727
Views
11
CrossRef citations to date
0
Altmetric
Original Articles

Individual Particle Morphology and Acidity

, , , , &
Pages 224-232 | Received 13 Sep 2007, Accepted 01 Feb 2008, Published online: 03 Apr 2008

Figures & data

TABLE 1 Summary of PAQS ambient concentrations for CCSEM analysis of the selected samples for CCSEM analysis (OC, organic carbon; EC, elemental carbon)

FIG. 1 Examples of the morphological groups for HRSEM analysis: (a–f) group A, particles with signs of a primary liquid state: (a–b) droplet-like, (c–e) needle-like, and (f) others; (g–h) group B, soot-like; (i–l) group C, regular-shaped particles; (m–n) group D, minerals, biogenic and others; and (o–p), group E, mixed particles. Particle geometric diameter, shape parameter values and HRSEM type also shown in the pictures.
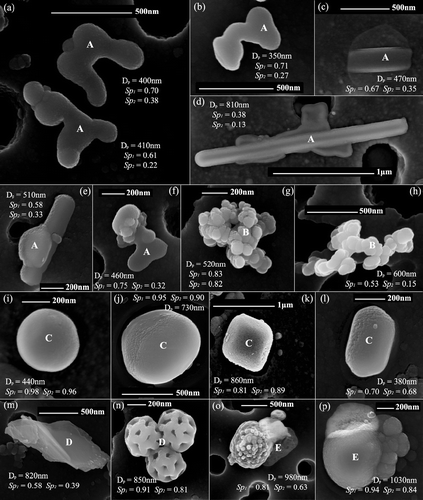
FIG. 1 Examples of the morphological groups for HRSEM analysis: (a–f) group A, particles with signs of a primary liquid state: (a–b) droplet-like, (c–e) needle-like, and (f) others; (g–h) group B, soot-like; (i–l) group C, regular-shaped particles; (m–n) group D, minerals, biogenic and others; and (o–p), group E, mixed particles. Particle geometric diameter, shape parameter values and HRSEM type also shown in the pictures.

TABLE 2 Daily acidity, CCSEM shape parameters, and HRSEM groups (columns A–E described in section 2.4) for particles below 1 μ m

TABLE 3 Sp 2 and Sp 3 mean value and standard deviation of the mean: summer acidic, summer neutral, and winter samples for particles below 1μ m

TABLE 4 Sp 2 and Sp 3 mean value and standard deviation of the mean for the summer acidic, summer neutral, and winter periods in three size ranges: 0.2–0.5 μ m, 0.5–1 μm, and 1.0–2.5 μ m

FIG. 2 Number distribution of particles classified based on sulfur content (relative X-ray counts) in the submicrometer range: Very low (non detectable S), Low (2–11%), Intermediate (12–21%), and High (22–33%) for summer samples, taken on acidic (a) and neutral days (b), and winter (c). The numbers in brackets on the top of each bar correspond to the median values of Sp 1 and Sp 2 in each group.
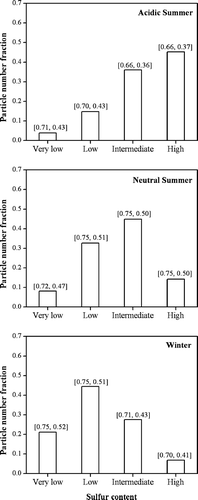
FIG. 2 Number distribution of particles classified based on sulfur content (relative X-ray counts) in the submicrometer range: Very low (non detectable S), Low (2–11%), Intermediate (12–21%), and High (22–33%) for summer samples, taken on acidic (a) and neutral days (b), and winter (c). The numbers in brackets on the top of each bar correspond to the median values of Sp 1 and Sp 2 in each group.

Reprints and Corporate Permissions

Please note: Selecting permissions does not provide access to the full text of the article, please see our help page How do I view content?

To request a reprint or corporate permissions for this article, please click on the relevant link below:

Academic Permissions

Please note: Selecting permissions does not provide access to the full text of the article, please see our help page How do I view content?

Obtain permissions instantly via Rightslink by clicking on the button below:

If you are unable to obtain permissions via Rightslink, please complete and submit this Permissions form. For more information, please visit our Permissions help page.