Figures & data
FIG. 9 Images of NaCl particles selected to determine the possible presence of contamination. The corresponding EDS spectra were obtained at the locations denoted with an “X.” The particles were prepared using a TSI atomizer and were deposited on a lacey-carbon film (no Formvar).
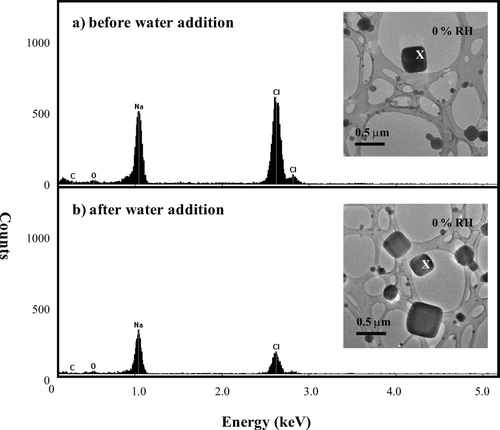
TABLE 1 Particle generation and collection methods
FIG. 1 Water uptake observed on the surfaces of NaCl particles at 74% RH. The thin arrow highlights particle rounding and water surrounding the solid core prior to deliquescence. The solid up arrow indicates increasing RH. The particles were prepared on an ultra-thin carbon film with a holey-carbon support film and generated using the bubbler method.
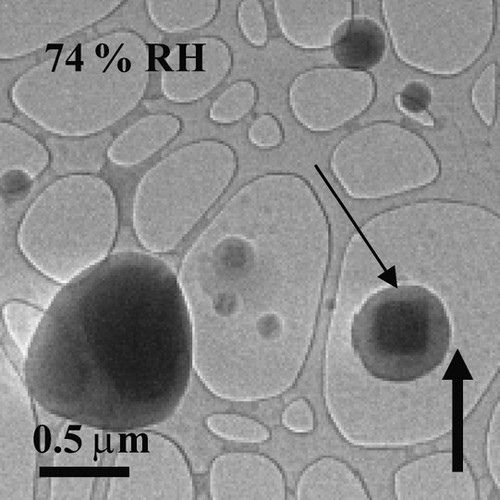
FIG. 2 Images of NaCl particles as the RH was increased (up arrows) past the deliquescence point and subsequently decreased (down arrows). The particles were prepared on a lacey-carbon support film (no Formvar) using a TSI atomizer.
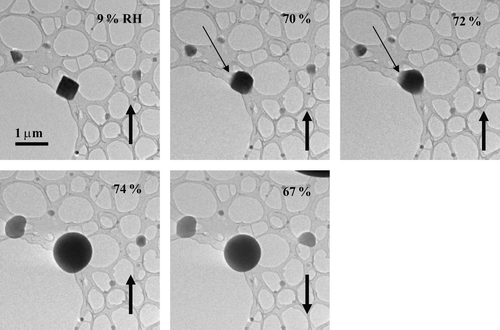
FIG. 3 Images of a 1.3-μm CaSO4 (column a) and a 2.3-μm CaSO4·2H 2O (column b) particle on an ultra-thin carbon film with a holey-carbon support film as RH was raised and held at 89%. The horizontal straight arrows indicate RH was held for an extended period of time.
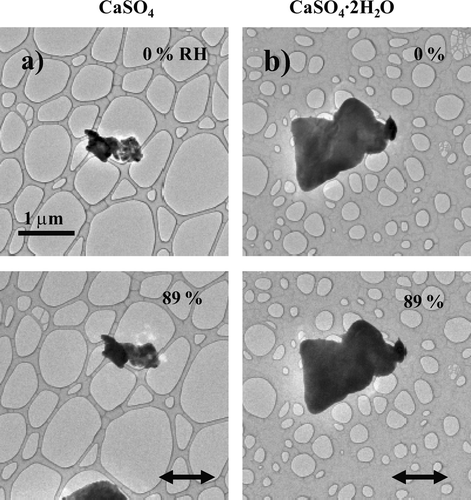
FIG. 4 Images of NaCl particles as the RH was raised and held at 72%. The thin arrows highlight that particle morphology did not observably change during 16 minutes of exposure to 72% RH. The particles were prepared using a TSI atomizer and were deposited on an ultra-thin carbon film with a holey-carbon support film.
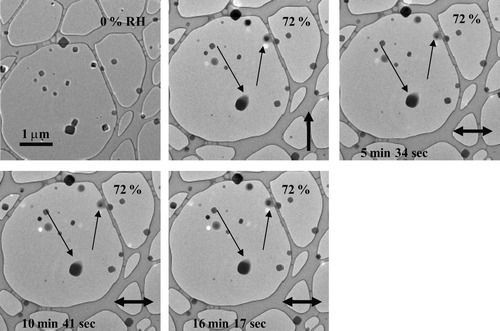
FIG. 5 Images of NaCl particles as the RH was twice increased and decreased. The particles were prepared using a TSI atomizer and were deposited on a lacey-carbon support film (without Formvar).
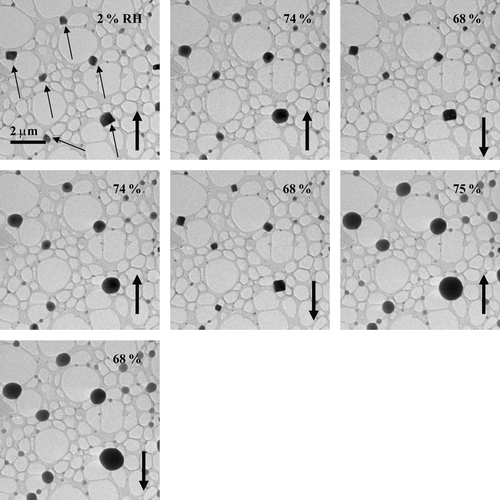
FIG. 6 Images of NaCl particles as the RH was raised and held at 73%. The particles were located at opposite sides of the sample grid and show that water uptake on the surfaces of the particles was independent of electron dosage (i.e., the particle shown in image a was exposed to the electron beam for significantly longer than the particle shown in image b). The particles were prepared using the bubbler method and were deposited on an ultra-thin carbon film with a holey-carbon support film.
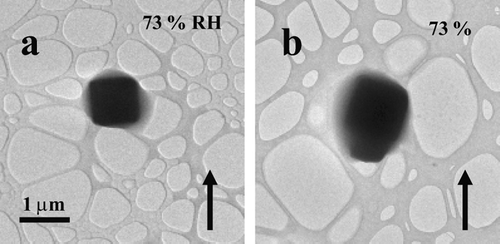
FIG. 7 (a) NaCl particles generated using the bubbler method at 74% RH. (b) ∼ 40 nm NaCl particles generated using the VCAG method at 75% RH. All particles were imaged on an ultra-thin carbon film with a holey-carbon support film.
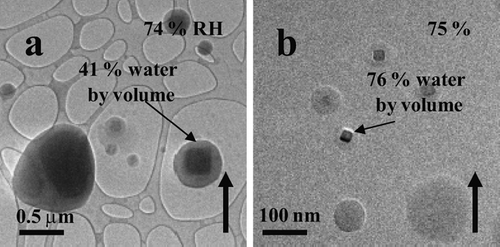
FIG. 8 ∼ 40 nm NaCl particles as the RH was increased past the deliquescence point. The thin arrows highlight water uptake prior to full deliquescence. The particles were prepared using the VCAG method and were deposited on an ultra-thin carbon film with a holey-carbon support film.
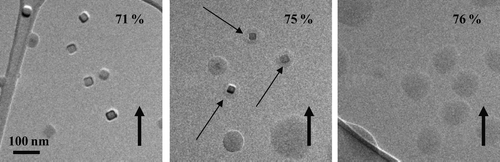
FIG. 10 Images of NaBr particles (top row) and a CsCl particle (bottom row) as the RH was increased past the deliquescence point of 48% for the NaBr particles and 68% for the CsCl particle. Thin arrows highlight particle rounding and water uptake prior to the DRH. The particles were prepared on a flat carbon film (with Formvar) and were generated using a TSI atomizer.
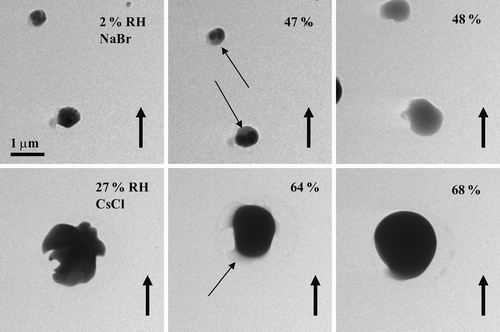
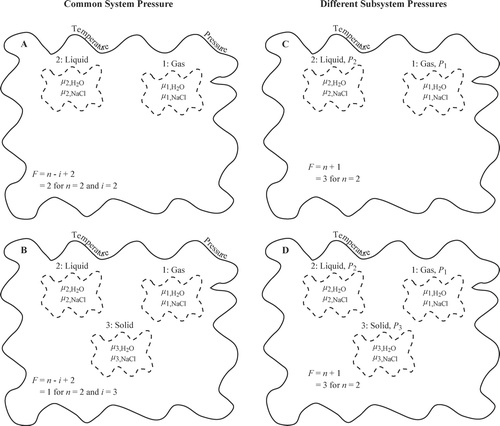
FIG. 11 Illustration of degrees of freedom for (A–C) a system having a common pressure and (D–F) a system for which subsystem pressure are heterogeneous. The Gibbs phase rule of F = n − i + 2 specifies the degrees of freedom for a system under common pressure, where n is the number of chemical components and i is the number of phases. The modified phase rule of F = n + 1 holds for subsystems of different pressures. In panels A–F, F is evaluated for n = 1.
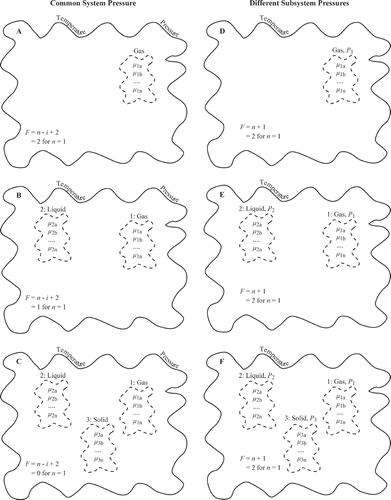
FIG. 12 Illustration of degrees of freedom for a two-component system of NaCl and H2O having (A–B) a common pressure and (C–D) subsystems of different pressures. Within the thermodynamic system, the water vapor, the aqueous solution, the particle, and the interfaces (including the particle/substrate interface) exchange both mass (practically speaking, H2O in the vapor, H2O and NaCl in the solution, and NaCl in the particle) and joules (chemical potential in vapor, solution, and particle and interfacial energies of substrate/particle, solution/particle, solution/vapor, and possibly vapor/particle).