1,260
Views
18
CrossRef citations to date
0
Altmetric
Original Articles

Single Charging of Nanoparticles by UV Photoionization at High Flow Rates

&
Pages 310-323 | Received 12 Oct 2007, Accepted 13 Mar 2008, Published online: 28 Apr 2008

Figures & data

TABLE 1 Model parameters used in the simulations

FIG. 1 Set-up for charging of monodisperse aerosols with the UV photoionizer.

FIG. 1 Set-up for charging of monodisperse aerosols with the UV photoionizer.

FIG. 2 Set-up for charging of polydisperse aerosols with the UV photoionizer and with the 85Kr ionizer.
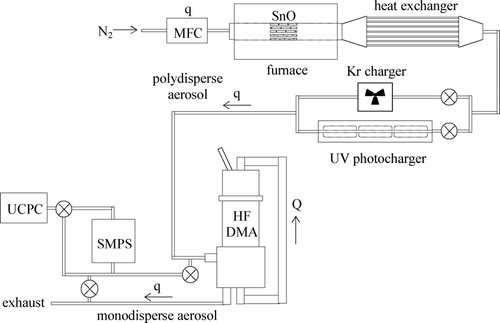
FIG. 2 Set-up for charging of polydisperse aerosols with the UV photoionizer and with the 85Kr ionizer.

FIG. 3 Charging efficiency of the UV photoionizer versus particle diameter under different irradiation conditions: t r = 0.16 s (q = 30 l· min−1), i = 0.5, 0.25, and 0.1 mA; and t r = 0.054 s (q = 90 l· min−1), i = 0.5 mA. Experimental values (symbols) and theoretical values (lines) calculated with Equations (5a)–(5d) for the indicated values of K.
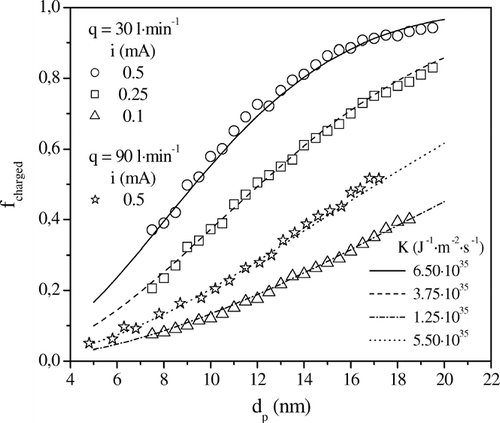
FIG. 3 Charging efficiency of the UV photoionizer versus particle diameter under different irradiation conditions: t r = 0.16 s (q = 30 l· min−1), i = 0.5, 0.25, and 0.1 mA; and t r = 0.054 s (q = 90 l· min−1), i = 0.5 mA. Experimental values (symbols) and theoretical values (lines) calculated with Equations (5a)–(5d) for the indicated values of K.

FIG. 4 The model parameter K vs. the intensity of the current supplied to the UV lamps. Experimental values (symbols) corresponding to t r = 0.16 s (q = 30 l· min−1), i = 0.5, 0.25, and 0.1 mA; and fitting polynomial (line).
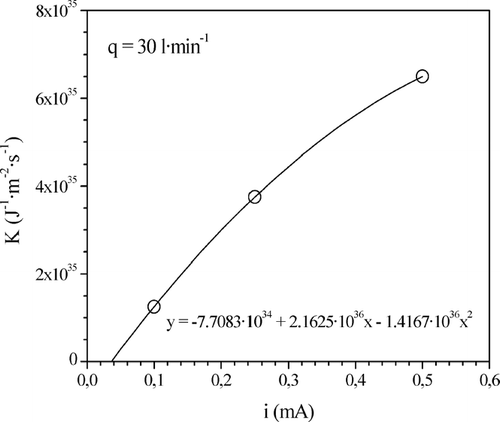
FIG. 4 The model parameter K vs. the intensity of the current supplied to the UV lamps. Experimental values (symbols) corresponding to t r = 0.16 s (q = 30 l· min−1), i = 0.5, 0.25, and 0.1 mA; and fitting polynomial (line).

FIG. 5 Particle mobility distributions measured at the outlet of the UV photocharger in experiments with monodisperse aerosols of the indicated particle diameters d g . Irradiation conditions were t r = 0.16 s (q = 30 l· min−1), i = 0.5, 0.25, and 0.1 mA.
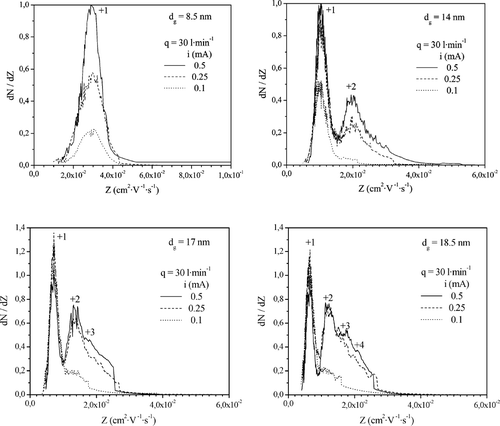
FIG. 5 Particle mobility distributions measured at the outlet of the UV photocharger in experiments with monodisperse aerosols of the indicated particle diameters d g . Irradiation conditions were t r = 0.16 s (q = 30 l· min−1), i = 0.5, 0.25, and 0.1 mA.

FIG. 6 Particle charge distributions of monodisperse aerosols calculated with the analytical solution for pure photocharging, Equations (5a)–(5d), for t r = 0.16 s (q = 30 l· min−1) and K = 6.5· 1035, 3.75· 1035 and 1.25· 1035 J−1· m−2· s−1 (i = 0.5, 0.25, and 0.1 mA).
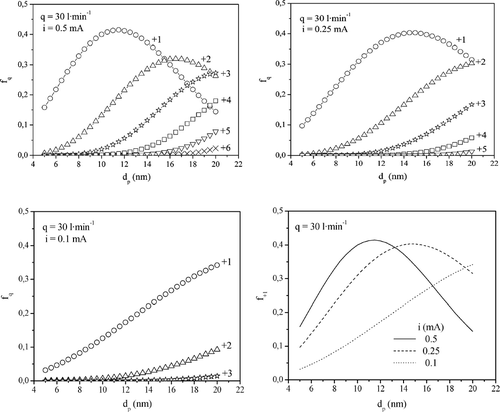
FIG. 6 Particle charge distributions of monodisperse aerosols calculated with the analytical solution for pure photocharging, Equations (5a)–(5d), for t r = 0.16 s (q = 30 l· min−1) and K = 6.5· 1035, 3.75· 1035 and 1.25· 1035 J−1· m−2· s−1 (i = 0.5, 0.25, and 0.1 mA).

FIG. 7 Particle mobility distributions measured at the outlet of the UV photocharger in experiments with monodisperse aerosols of the indicated particle diameters d g . Irradiation conditions were t r = 0.054 s (q = 90 l· min−1) and i = 0.5 mA.
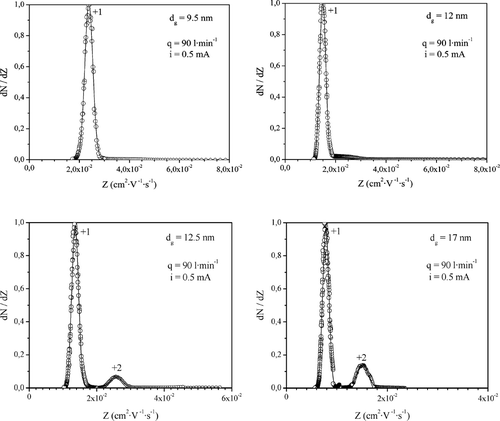
FIG. 7 Particle mobility distributions measured at the outlet of the UV photocharger in experiments with monodisperse aerosols of the indicated particle diameters d g . Irradiation conditions were t r = 0.054 s (q = 90 l· min−1) and i = 0.5 mA.

FIG. 8 Particle charge distributions of monodisperse aerosols calculated with the analytical solution for pure photocharging, Equations (5a)–(5d), for t r = 0.054 s (q = 90 l· min−1) and K = 5.5· 1035 J−1· m−2· s−1 (i = 0.5 mA).
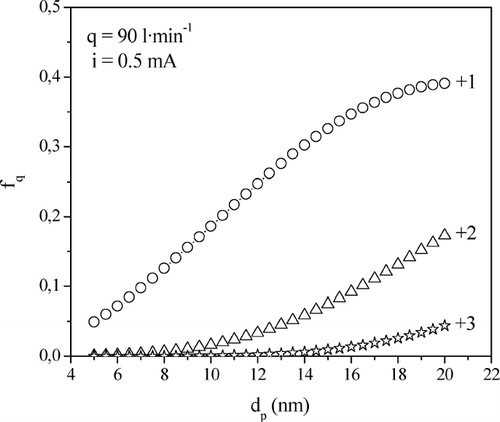
FIG. 8 Particle charge distributions of monodisperse aerosols calculated with the analytical solution for pure photocharging, Equations (5a)–(5d), for t r = 0.054 s (q = 90 l· min−1) and K = 5.5· 1035 J−1· m−2· s−1 (i = 0.5 mA).

TABLE 2 Description and conditions of the experiments with polydisperse aerosols

FIG. 9 Particle size distributions measured at the outlet of the HF-DMA using the UV photoionizer to charge polydisperse aerosols with particle concentrations N p of 2.1· 107 cm−3 (top) and 3.8· 107 cm−3 (bottom) at a flow rate q of 30 l· min−1. Irradiation conditions were t r = 0.054 s in both experiments, i = 0.5 and 0.1 mA (top), i = 0.1 and 0.04 mA (bottom).
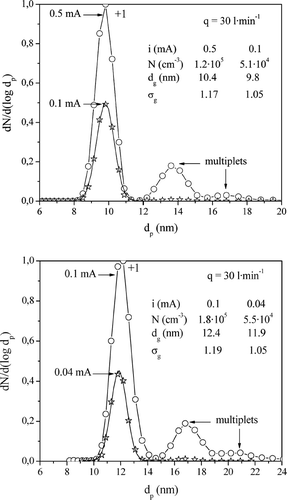
FIG. 9 Particle size distributions measured at the outlet of the HF-DMA using the UV photoionizer to charge polydisperse aerosols with particle concentrations N p of 2.1· 107 cm−3 (top) and 3.8· 107 cm−3 (bottom) at a flow rate q of 30 l· min−1. Irradiation conditions were t r = 0.054 s in both experiments, i = 0.5 and 0.1 mA (top), i = 0.1 and 0.04 mA (bottom).

FIG. 10 Particle size distributions of monodisperse aerosols measured at the outlet of the HF-DMA using the 85Kr ionizer (top) and the UV photoionizer (bottom) to charge polydisperse aerosols with a particle concentration N p of 3.2· 107 cm−3 at a flow rate q of 90 l· min−1. A geometric standard deviation σ g ∼ 1.05 was obtained for particles of all sizes with the two aerosol chargers.
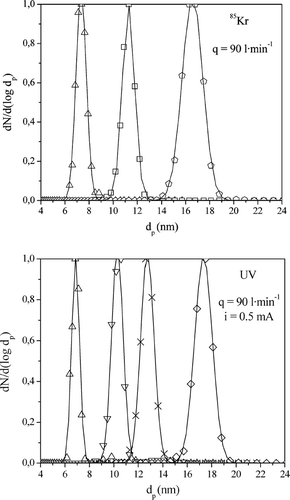
FIG. 10 Particle size distributions of monodisperse aerosols measured at the outlet of the HF-DMA using the 85Kr ionizer (top) and the UV photoionizer (bottom) to charge polydisperse aerosols with a particle concentration N p of 3.2· 107 cm−3 at a flow rate q of 90 l· min−1. A geometric standard deviation σ g ∼ 1.05 was obtained for particles of all sizes with the two aerosol chargers.

FIG. 11 Comparison of particle number concentrations of monodisperse aerosols measured at the outlet of the HF-DMA using the 85Kr ionizer and the UV photoionizer to charge polydisperse aerosols at flow rates q of 30 l· min−1 (top) and 90 l· min−1 (bottom).
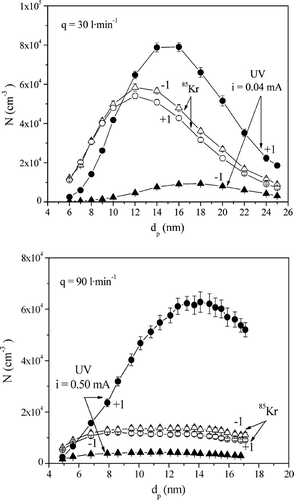
FIG. 11 Comparison of particle number concentrations of monodisperse aerosols measured at the outlet of the HF-DMA using the 85Kr ionizer and the UV photoionizer to charge polydisperse aerosols at flow rates q of 30 l· min−1 (top) and 90 l· min−1 (bottom).

FIG. 12 Comparison of the fraction of charged particles (top) and the particle charge distribution (bottom) at the outlet of the UV photoionizer calculated with the analytical solution for pure photocharging, Equations (5a)–(5d), for the experiments with monodisperse aerosols and with the numerical model including diffusion charging, Equations (1a)–(1c), for an experiment with a polydisperse aerosol. Irradiation conditions were t r = 0.054 s (q = 90 l· min−1) and i = 0.5 mA; ion and particle losses were not considered.
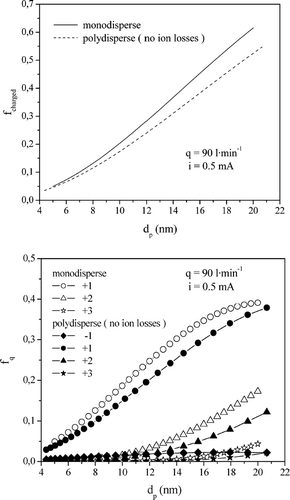
FIG. 12 Comparison of the fraction of charged particles (top) and the particle charge distribution (bottom) at the outlet of the UV photoionizer calculated with the analytical solution for pure photocharging, Equations (5a)–(5d), for the experiments with monodisperse aerosols and with the numerical model including diffusion charging, Equations (1a)–(1c), for an experiment with a polydisperse aerosol. Irradiation conditions were t r = 0.054 s (q = 90 l· min−1) and i = 0.5 mA; ion and particle losses were not considered.

FIG. 13 Fractions of singly charged particles (top) and ratio of singly negatively to singly positively charged particles (bottom) in the aerosol at the outlet of the UV photoionizer, at the inlet of the HF-DMA, and at the aerosol slit calculated with the numerical model including diffusion charging, Equations (1a)–(1c), and experimental values of N − 1/N+ 1 (open circles). Irradiation conditions were t r = 0.054 s (q = 90 l· min−1) and i = 0.5 mA; ion and particle losses were not considered in the calculation.
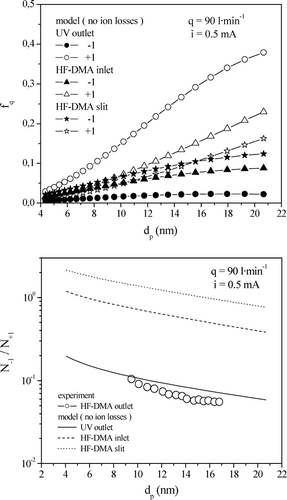
FIG. 13 Fractions of singly charged particles (top) and ratio of singly negatively to singly positively charged particles (bottom) in the aerosol at the outlet of the UV photoionizer, at the inlet of the HF-DMA, and at the aerosol slit calculated with the numerical model including diffusion charging, Equations (1a)–(1c), and experimental values of N − 1/N+ 1 (open circles). Irradiation conditions were t r = 0.054 s (q = 90 l· min−1) and i = 0.5 mA; ion and particle losses were not considered in the calculation.

FIG. 14 Fractions of singly charged nanoparticles f ± 1 (top) and ratio of singly negatively to singly positively charged particles N − 1/N + 1 (bottom) in the aerosol at the outlet of the UV photoionizer, at the inlet of the HF-DMA, and at the aerosol slit calculated with the numerical model including diffusion charging, Equations (1a)–(1c), and experimental values of N − 1/N + 1 (open circles). Irradiation conditions were t r = 0.054 s (q = 90 l· min−1) and i = 0.5 mA; an ion depletion rate w i,UV of 77 s−1 was assumed in the calculation.
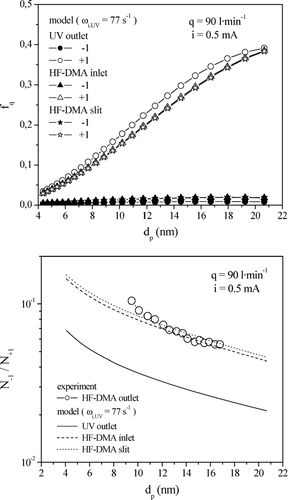
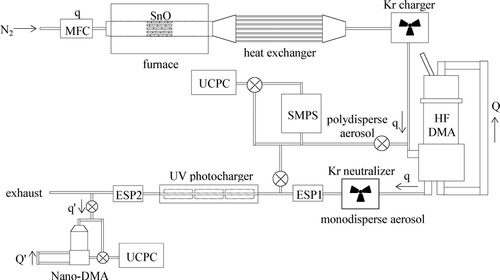
FIG. 14 Fractions of singly charged nanoparticles f ± 1 (top) and ratio of singly negatively to singly positively charged particles N − 1/N + 1 (bottom) in the aerosol at the outlet of the UV photoionizer, at the inlet of the HF-DMA, and at the aerosol slit calculated with the numerical model including diffusion charging, Equations (1a)–(1c), and experimental values of N − 1/N + 1 (open circles). Irradiation conditions were t r = 0.054 s (q = 90 l· min−1) and i = 0.5 mA; an ion depletion rate w i,UV of 77 s−1 was assumed in the calculation.

Reprints and Corporate Permissions

Please note: Selecting permissions does not provide access to the full text of the article, please see our help page How do I view content?

To request a reprint or corporate permissions for this article, please click on the relevant link below:

Academic Permissions

Please note: Selecting permissions does not provide access to the full text of the article, please see our help page How do I view content?

Obtain permissions instantly via Rightslink by clicking on the button below:

If you are unable to obtain permissions via Rightslink, please complete and submit this Permissions form. For more information, please visit our Permissions help page.