1,567
Views
41
CrossRef citations to date
0
Altmetric
Original Articles

The University of Toronto Continuous Flow Diffusion Chamber (UT-CFDC): A Simple Design for Ice Nucleation Studies

&
Pages 730-738 | Received 02 Oct 2008, Accepted 10 Mar 2009, Published online: 23 Apr 2009

Figures & data

FIG. 1 Supersaturation profile in a CFDC. This example illustrates a case where the cold wall is at 213 K and warm wall at 233 K (vertical dash-dotted lines), and sample temperature of 223 K in the center. Open-symbol-line: equilibrium vapor pressure of water with respect to water. Closed-symbol-line: the same but with respect to ice. Black straight line: steady state partial pressure of water across the chamber. Dash dotted curve: saturation profile in chamber with respect to water. Dotted curve: same but with respect to ice. The colored lines refer to the left axis and the black ones to the right. For most experiments the saturation ratio with respect to water did not exceed 1. (Figure provided in color online.)
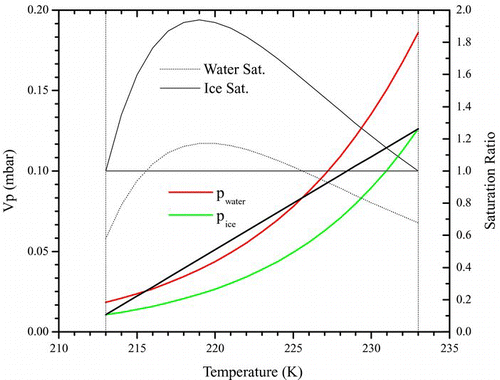
FIG. 1 Supersaturation profile in a CFDC. This example illustrates a case where the cold wall is at 213 K and warm wall at 233 K (vertical dash-dotted lines), and sample temperature of 223 K in the center. Open-symbol-line: equilibrium vapor pressure of water with respect to water. Closed-symbol-line: the same but with respect to ice. Black straight line: steady state partial pressure of water across the chamber. Dash dotted curve: saturation profile in chamber with respect to water. Dotted curve: same but with respect to ice. The colored lines refer to the left axis and the black ones to the right. For most experiments the saturation ratio with respect to water did not exceed 1. (Figure provided in color online.)

FIG. 2 Schematic showing the setup of the entire system as an IN counter. Directions of arrows indicate direction of flow of aerosols. Refer to text for acronym definitions.
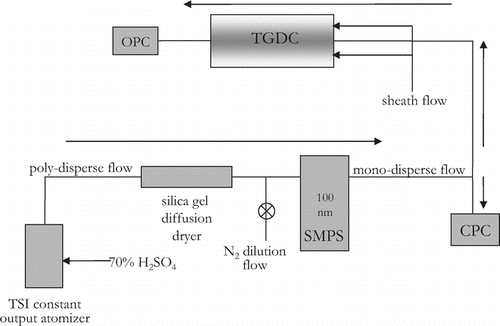
FIG. 2 Schematic showing the setup of the entire system as an IN counter. Directions of arrows indicate direction of flow of aerosols. Refer to text for acronym definitions.

FIG. 3 Lengthwise cross-section of chamber. Bold arrows indicate direction of particle-free sheath air that makes up about 90% of the total flow in the chamber. The remaining 10% is made up by the sample flow indicated by thinner arrow. (Figure provided in color online.)
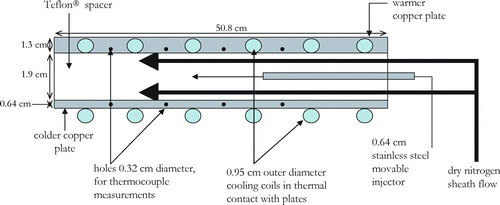
FIG. 3 Lengthwise cross-section of chamber. Bold arrows indicate direction of particle-free sheath air that makes up about 90% of the total flow in the chamber. The remaining 10% is made up by the sample flow indicated by thinner arrow. (Figure provided in color online.)

FIG. 4 Top-view of the Teflon® spacer that is sandwiched between the warm and cold copper plates. The O-ring seal between the three pieces (on either side of the Teflon® spacer) ensures the chamber is air tight. The injector has 6 ports that allow sample into the chamber. The minimum residence time for the aerosol is achieved by pushing the injector in all the way so that aerosol is introduced into the chamber where the cone shape of the chamber begins. To ensure stability, the ends of the injector slide within a notch in the Teflon® spacer.
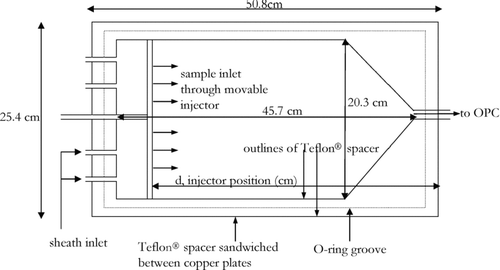
FIG. 4 Top-view of the Teflon® spacer that is sandwiched between the warm and cold copper plates. The O-ring seal between the three pieces (on either side of the Teflon® spacer) ensures the chamber is air tight. The injector has 6 ports that allow sample into the chamber. The minimum residence time for the aerosol is achieved by pushing the injector in all the way so that aerosol is introduced into the chamber where the cone shape of the chamber begins. To ensure stability, the ends of the injector slide within a notch in the Teflon® spacer.

FIG. 5 Activation curve for 230 K derived from a typical ice nucleation experiment. The RH of the chamber is increased and concentration of ice crystals monitored. The activated fraction is the ratio of OPC counts to particle counts, derived from the CPC. The dashed line indicates for this temperature where we expect to see homogenous freezing of 100 nm H2SO4 taken from Koop et al. (2000). Note that the large particle channel also increases indicating the presence of ice. The particles in the smaller size channel could also be water droplets after water saturation has been surpassed.
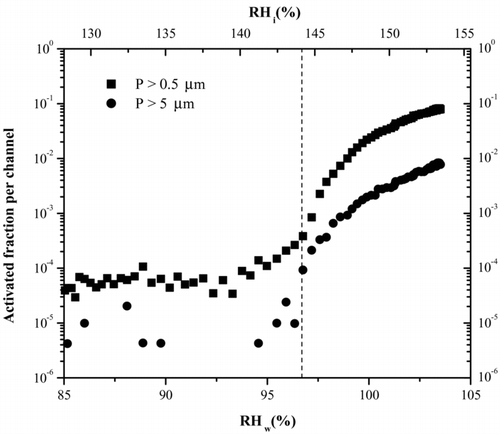
FIG. 5 Activation curve for 230 K derived from a typical ice nucleation experiment. The RH of the chamber is increased and concentration of ice crystals monitored. The activated fraction is the ratio of OPC counts to particle counts, derived from the CPC. The dashed line indicates for this temperature where we expect to see homogenous freezing of 100 nm H2SO4 taken from Koop et al. (2000). Note that the large particle channel also increases indicating the presence of ice. The particles in the smaller size channel could also be water droplets after water saturation has been surpassed.

FIG. 6 Fraction of ATD particles that activate as ice crystals as a function of residence time in the UT-CFDC. These data were collected at 223 K and RHw = 99%. The work presented in this article was all carried out at a residence time of 12 seconds, which corresponds to an injector position of 30 cm. The numbers next to the data points indicate the corresponding residence times.
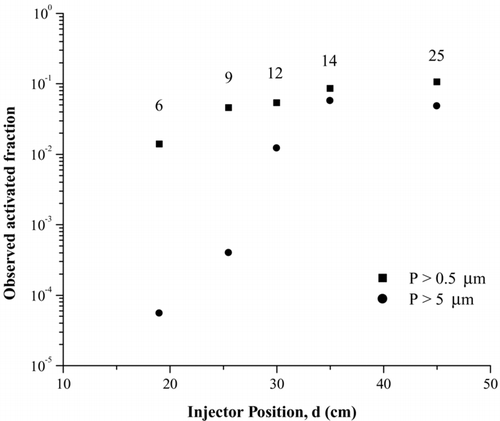
FIG. 6 Fraction of ATD particles that activate as ice crystals as a function of residence time in the UT-CFDC. These data were collected at 223 K and RHw = 99%. The work presented in this article was all carried out at a residence time of 12 seconds, which corresponds to an injector position of 30 cm. The numbers next to the data points indicate the corresponding residence times.

FIG. 7 Summary of the 100 nm H2SO4 homogeneous freezing experiments over a range of temperatures. Squares: Freezing fraction of at least 0.1% or more of the particles. Stars: freezing of 0.1% of 50 nm H2SO4 particles from Chen et al. (2000). Also, refer to text for explanation of the circle-shaped data points. The activated fraction was determined using the sum of the counts from the large and small particle channels. Error bars represent 1σ from at least 3 runs during an experiment.
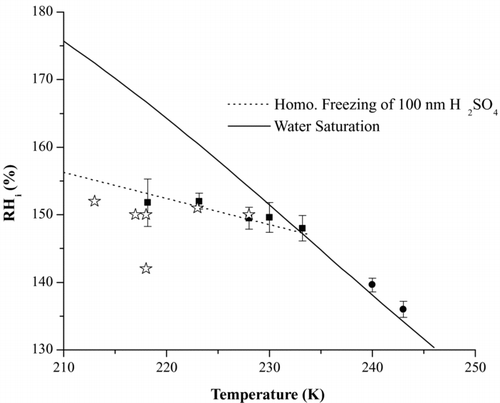
FIG. 7 Summary of the 100 nm H2SO4 homogeneous freezing experiments over a range of temperatures. Squares: Freezing fraction of at least 0.1% or more of the particles. Stars: freezing of 0.1% of 50 nm H2SO4 particles from Chen et al. (2000). Also, refer to text for explanation of the circle-shaped data points. The activated fraction was determined using the sum of the counts from the large and small particle channels. Error bars represent 1σ from at least 3 runs during an experiment.

FIG. 8 Activation curve of H2SO4 aerosols at 240 K This temperature is above where we expect homogeneous freezing and therefore no ice formation should be observed. Note that once water saturation has been reached, the P > 0.5 μ m channel (squares) starts to increase indicating water droplet formation. However the P > 5μ m channel (circles) remains at background level, indicating no ice formation.
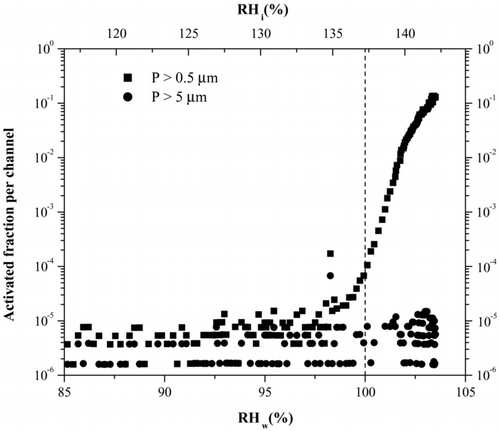
FIG. 8 Activation curve of H2SO4 aerosols at 240 K This temperature is above where we expect homogeneous freezing and therefore no ice formation should be observed. Note that once water saturation has been reached, the P > 0.5 μ m channel (squares) starts to increase indicating water droplet formation. However the P > 5μ m channel (circles) remains at background level, indicating no ice formation.

Reprints and Corporate Permissions

Please note: Selecting permissions does not provide access to the full text of the article, please see our help page How do I view content?

To request a reprint or corporate permissions for this article, please click on the relevant link below:

Academic Permissions

Please note: Selecting permissions does not provide access to the full text of the article, please see our help page How do I view content?

Obtain permissions instantly via Rightslink by clicking on the button below:

If you are unable to obtain permissions via Rightslink, please complete and submit this Permissions form. For more information, please visit our Permissions help page.