745
Views
7
CrossRef citations to date
0
Altmetric
Original Articles

Experimental Determination of Supermicrometer Particle Fate Subsequent to a Point Release within a Room under Natural and Forced Mixing

&
Pages 921-938 | Received 29 Jan 2009, Accepted 05 May 2009, Published online: 16 Jun 2009

Figures & data

FIG. 1 The floor plan of the experimental chamber. Grid rows are denoted by numbers and columns by letters, with length aspect 0.3 m. Aerosol was released in grid point 7C (star) at height 0.64 m. Forced mixing was induced by two 0.08 m diameter instrument fans on the floor at grid point 1D (boxes, arrows indicate direction of flow). The 0.3 m diameter exhaust fan was located in the wall, on the floor, at grid point 9F (box, arrow indicates direction of flow).
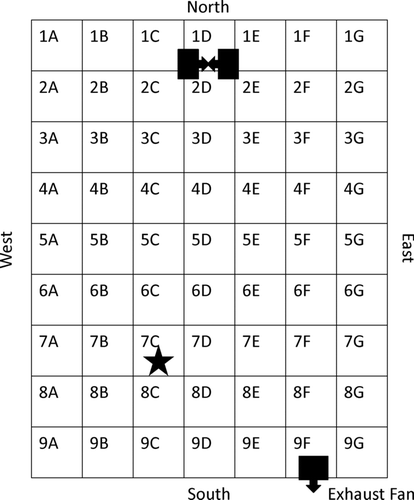
FIG. 1 The floor plan of the experimental chamber. Grid rows are denoted by numbers and columns by letters, with length aspect 0.3 m. Aerosol was released in grid point 7C (star) at height 0.64 m. Forced mixing was induced by two 0.08 m diameter instrument fans on the floor at grid point 1D (boxes, arrows indicate direction of flow). The 0.3 m diameter exhaust fan was located in the wall, on the floor, at grid point 9F (box, arrow indicates direction of flow).

TABLE 1 In all experiments (Exp), the Vibrating Orifice Aerosol Generator (VOAG) was operated with a 20 μ m orifice, fluid flow rate of 0.44 mL/min, and the specified frequency (Freq). Temperature (Temp) and relative humidity (RH) were measured in the chamber core prior to the aerosol release

TABLE 2 Cumulative fluorescein mass, relative to the mean value in each trial, deposited on 0.02 m3 foil floor samplers centered in each grid point over 90 min (20 min aerosol release followed by 70 min of deposition) under natural and forced mixing. Aerosol was released 0.64 m above the floor at grid point 7C. Forced mixing was induced by two 0.08 m diameter instrument fans on the floor, blowing towards each other in grid point 1D

FIG. 2 Cumulative fluorescein mass deposition, relative to the mean value in each trial, on the chamber floor for particles with nominal da = 3 μ m under natural mixing conditions over 90 min (20 min aerosol release followed by 70 min of deposition). Aerosol was released 0.64 m above the floor at grid point 7C.

FIG. 2 Cumulative fluorescein mass deposition, relative to the mean value in each trial, on the chamber floor for particles with nominal da = 3 μ m under natural mixing conditions over 90 min (20 min aerosol release followed by 70 min of deposition). Aerosol was released 0.64 m above the floor at grid point 7C.
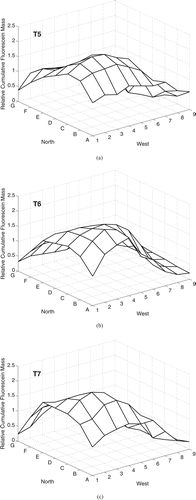
FIG. 3 Cumulative fluorescein mass deposition, relative to the mean value in each trial, on the chamber floor for particles with nominal da = 14 μ m under natural mixing conditions over 90 min (20 min aerosol release followed by 70 min of deposition). Aerosol was released 0.64 m above the floor at grid point 7C.

FIG. 3 Cumulative fluorescein mass deposition, relative to the mean value in each trial, on the chamber floor for particles with nominal da = 14 μ m under natural mixing conditions over 90 min (20 min aerosol release followed by 70 min of deposition). Aerosol was released 0.64 m above the floor at grid point 7C.

FIG. 4 Cumulative fluorescein mass deposition, relative to the mean value in each trial, on the chamber floor for particles with nominal da = 3 μ m under forced mixing conditions over 90 min (20 min aerosol release followed by 70 min of deposition). Aerosol was released 0.64 m above the floor at grid point 7C. Mixing was induced by two fans blowing towards each other on the floor in grid point 1D.

FIG. 4 Cumulative fluorescein mass deposition, relative to the mean value in each trial, on the chamber floor for particles with nominal da = 3 μ m under forced mixing conditions over 90 min (20 min aerosol release followed by 70 min of deposition). Aerosol was released 0.64 m above the floor at grid point 7C. Mixing was induced by two fans blowing towards each other on the floor in grid point 1D.
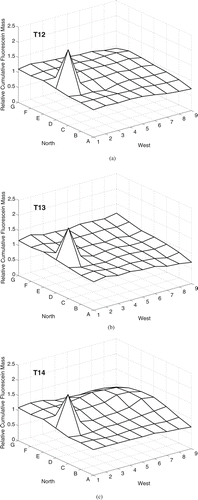
FIG. 5 Cumulative fluorescein mass deposition, relative to the mean value in each trial, on the chamber floor for particles with nominal da = 14 μ m under forced mixing conditions over 90 min (20 min aerosol release followed by 70 min of deposition). Aerosol was released 0.64 m above the floor at grid point 7C. Mixing was induced by two fans blowing towards each other on the floor in grid point 1D.

FIG. 5 Cumulative fluorescein mass deposition, relative to the mean value in each trial, on the chamber floor for particles with nominal da = 14 μ m under forced mixing conditions over 90 min (20 min aerosol release followed by 70 min of deposition). Aerosol was released 0.64 m above the floor at grid point 7C. Mixing was induced by two fans blowing towards each other on the floor in grid point 1D.

TABLE A-1 Mean and fluctuating velocities ((u,v,w), (σ u v w )) and mean and fluctuating speed (U s , σ s ) from combined anemometry measurements for each location and height in the forced mixing condition. Mixing was induced by two 0.08 m diameter instrument fans blowing towards each other on the floor in grid point 1D

TABLE A-2 Comulative fluorescein mass deposited 0.02 m2 foil samplers on the chamber walls, relative to the mean value of the cumulative fluorescein mass deposited on chamber floor over 90 min (20 min aerosol release followed by 70 min of deposition under natural mixing). Samplers were centered 1.12 m above the floor, and centered in each wall, lengthwise

TABLE A-3 Time-weighted-average fluorescein mass concentration (CTWA) relative to the mean value in each trial, measured at 1.5 m above the floor over 90 min (20 min aerosol release followed by 70 min of deposition) under natural and forced mixing conditions. Aerosol was released 0.64 m above the floor at grid point 7C. Forced mixing was induced by two 0.08 m diameter instrument fans on the floor, blowing towards each other in grid point 1D

Reprints and Corporate Permissions

Please note: Selecting permissions does not provide access to the full text of the article, please see our help page How do I view content?

To request a reprint or corporate permissions for this article, please click on the relevant link below:

Academic Permissions

Please note: Selecting permissions does not provide access to the full text of the article, please see our help page How do I view content?

Obtain permissions instantly via Rightslink by clicking on the button below:

If you are unable to obtain permissions via Rightslink, please complete and submit this Permissions form. For more information, please visit our Permissions help page.