Figures & data
TABLE 1 The IMPROVE_A carbon sub-fraction measurement conditions including the target filter temperatures and the sample oven sensor setpoint temperatures (TSETPOINT) for the UCD Sunset Analyzer (S/N 119) that produce the IMPROVE_A temperatures at the filter
FIG. 1 (a) The sample analysis configuration and (b) the temperature calibration configuration of a Sunset Laboratory Carbon Aerosol Analysis Lab Instrument. The temperature calibration apparatus consists of a modified quartz boat handle and quartz cap, which enables a thermocouple to be placed at the filter sample while maintaining the functionality of the original components. Details of the modification are labeled in blue in .
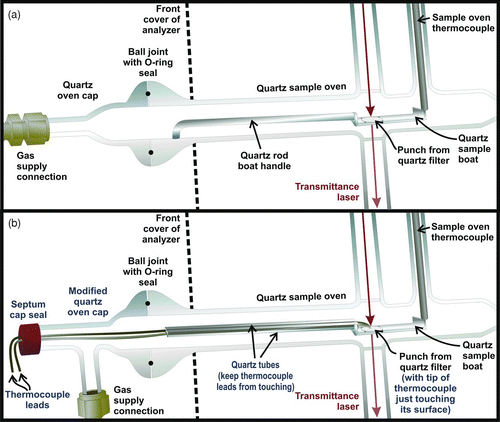
TABLE 2 Filter temperatures achieved using a calibration based on Tempilaq° G data and measured at the filter by an external thermocouple probe. Measurements performed on a DRI Model 2001 Analyzer
FIG. 2 Temperature calibration data for the UCD Sunset Instrument. The regression parameters are listed in .
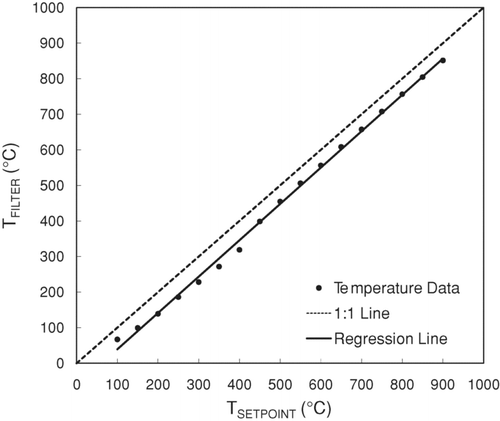
TABLE 3 Linear calibration constants (with ±95% confidence intervals) for Sunset Instruments at UCD, ASU, and RTI
FIG. 3 Mean concentration and standard deviation of (a) Total Carbon (TC), (b) Organic Carbon (OC), and (c) Elemental Carbon (EC) for samples analyzed with IMPROVE_A target filter temperatures at the sample oven and IMPROVE_A target filter temperatures at the filter. TSETPOINT values used to obtain IMPROVE_A temperatures at the filter are given in . TC (p = 0.17), OC (p = 0.05) and EC concentrations (p = 0.06) are not significantly different from each other.
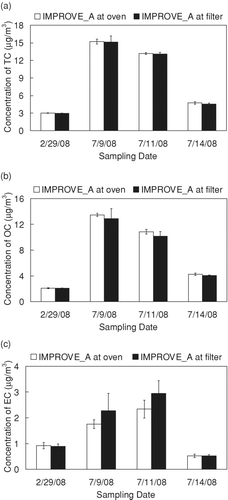
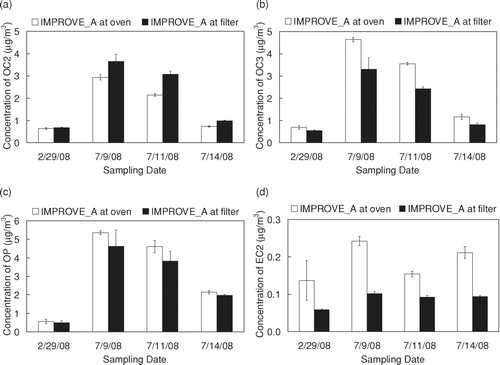
FIG. 4 Mean concentration and standard deviation of (a) OC2, (b) OC3, (c) OP, and (d) EC2 for filters analyzed with IMPROVE_A target filter temperatures at the sample oven and IMPROVE_A target filter temperatures at the filter. TSETPOINT values used to obtain IMPROVE_A temperatures at the filter are given in . OC2 (p < 0.01), OC3 (p < 0.01), OP (p = 0.01), and EC2 (p < 0.01) are statistically different under the two temperature profiles.