Figures & data
TABLE 1 Property summary of sub-1 micron aerosols generated for the study. For polydisperse particles, the size is the number mean diameter obtained from size distribution tests. DOS is a Fluka, Inc. product; the other compounds are commercially available at Sigma-Aldrich Inc.
FIG. 1 Schematic diagram of the experimental setup used in this study.
FIG. 2 (a) σsp measured by the TSI nephelometer (corrected using the AO98 expression, and converted to 532 nm) displayed versus the σep measured by the CRD for sub-1 micron dry AS particles (slope = 0.998, R2= 0.999). (b) TSI nephelometer submicron correction factors determined by the AO98 correction plus wavelength conversion (Cλ,AO98, solid line) and fit to the experimental data plus wavelength conversion (Cλ,EXP, dashed line) for polydisperse AS, NaCl, and DOS particles. Error bars are ±3.0% (1-σ uncertainty).
FIG. 3 Ratio (R) of scattering values obtained by difference (σep minus σap) and directly measured by TSI nephelometer (σsp) plotted as a function of ω1. Data are for AS/NSN internal mixtures. The σsp coefficients are corrected using the AO98 scheme and converted to 532 nm. Error bars are calculated by propagating the absolute uncertainties of the optical coefficients (δσep= 1%; δσap= 5%; δσsp= 3% following normalization with the CRD).
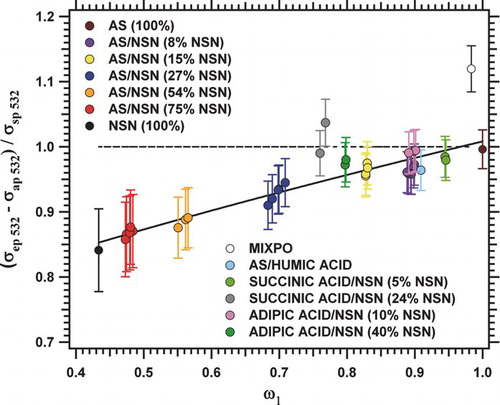
TABLE 2 Input parameters for Mie code calculations to estimate ω values for the internally mixed AS/NSN particles. From left to right columns are: NSN percentage in the mixture; RI calculated by the linear mixing rule (Equation [3]); size calculated for the internally mixed particles; single scattering albedo values from Mie code (ωMie); and the experimental ω data, i.e., ω1, ω2, and ω3
FIG. 4 Experimental (ω1, ω2, ω3) and theoretical (ωMie) single scattering albedo values for internal mixtures AS/NSN, reported versus the mass percentage of AS in the mixture.
FIG. 5 TSI 3563 nephelometer correction factors C calculated using Mie theory for various RI values, for submicron aerosols (panels a and b) and for sizes up to 2 μm (panels c and d). Points are color coded either by n (panels a and c) or ω (panels b and d). The thin solid lines of panel a show a correction calculated as a function of n only. The dashed line is the C from AO98; the solid lines are the C values from Equations (Equation4) and (Equation5
). Circles are calculations for NSN (n= 1.7, k=0.3).
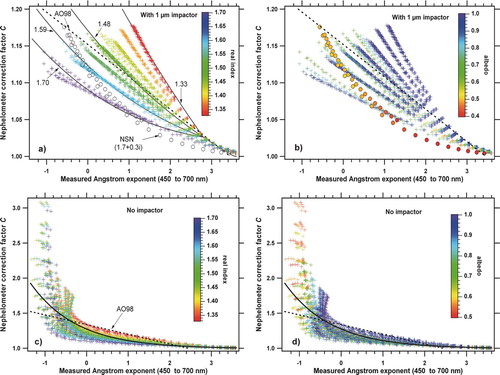
FIG. 6 Ratio (R) of scattering values obtained by difference (σep minus σap) and directly measured by TSI nephelometer (σsp) plotted as a function of ω1 for the AS/NSN mixtures with 27%, 54%, 75%, and 100% NSN. Theσsp coefficients are corrected using the real-refractive index dependent correction term C from Equations (Equation4) and (Equation5
).
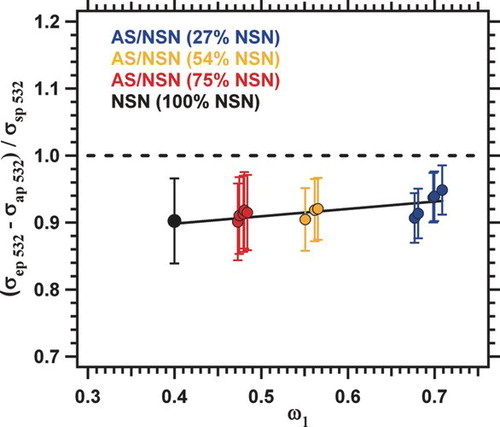
FIG. 7 (a) Percentage uncertainty inσsp from TSI nephelometer (δσsp) calculated using the AO98 scheme (triangles) and corrected using Equations (Equation4) and (Equation5
) (squares), and (b) percentage uncertainties of single scattering albedo δω1 (CRD and PAS) and δω2 (CRD and TSI nephelometer). δω1 is calculated using δσep= 1% and δσap = 5%. δω2 is calculated combining δσep=1% with either δσsp AO98 (triangles) or δσsp Equations (Equation4
) and (Equation5
) (squares).