Figures & data
FIG. 1 Bioaerosol samplers. (a) AGI-30 impinger. (b) SKC BioSampler impinger. (c) Batch wetted wall cyclone with compensation for liquid evaporation (BWWC-CE). (d). Batch wetted wall cyclone with no compensation for evaporation (BWWC-NC).
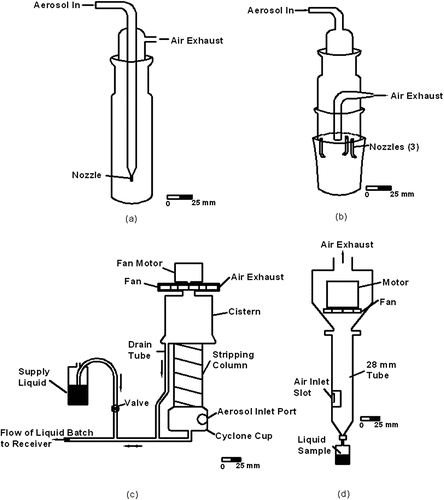
FIG. 2 Sampling efficiencies of the bioaerosol collectors. (a) AGI-30 impinger. (b). SKC BioSampler impinger. (c). Batch-type wetted wall cyclone with compensation for evaporation (BWWC-EC). (d) Batch-type wetted wall cyclone with no compensation for evaporation (BWWC-NC). Error bars are ± 1 standard deviation about a mean.
FIG. 3 Retention efficiency of polystyrene particles. (a) AGI-30. (b) SKC BioSampler. (c). BWWC-EC. (d) BWWC-NC. The AGI and SKC BioSampler are represented by AGI and BS in the legend. Error bars are ± 1 standard deviation about a mean.
FIG. 4 Retention efficiencies of the AGI-30 (AGI) and SKC Biosampler (BS) for (a) Bacillus atrophaeus (BA) spores, and (b) Pantoea agglomerans (Pa) vegitative cells after 1 h. Comparative results are shown for non-viable 1 μ m polystyrene spheres (PSL), which were added to each hydrosol suspension to provide a reference. Error bars are ± 1 standard deviation about a mean value.
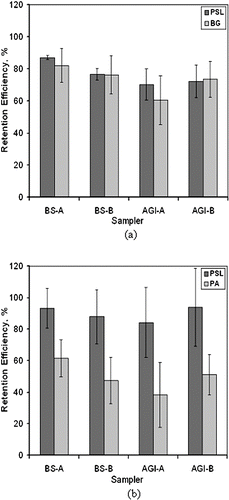
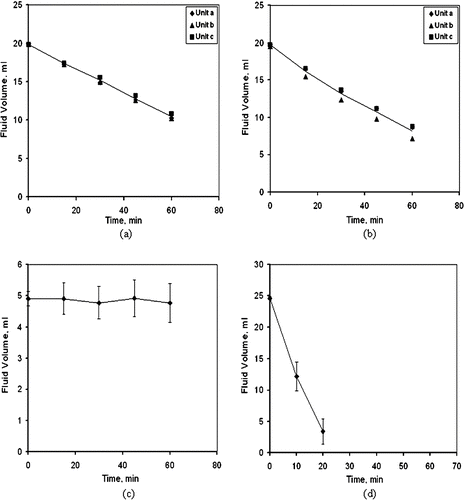
FIG. 5 Change in liquid volume with time. Collectors operated in laboratory environment. Losses are primarily due to evaporation. (a) AGI-30 impinger. (b) SKC BioSampler. (c) BWWC-EC. (d) BWWC-NC. Error bars are ± 1 standard deviation about a mean.