4,749
Views
217
CrossRef citations to date
0
Altmetric
Regular Articles

Design, Calibration, and Field Performance of a Miniature Diffusion Size Classifier

, , &
Pages 1-10 | Received 27 May 2010, Accepted 12 Jul 2010, Published online: 09 Jun 2011

Figures & data

FIG. 1 Schematic overview of the miniature DiSC: Aerosol is charged in a unipolar corona charger which controls the charging current, excess ions are removed in the ion trap, and the charged aerosol is measured in two electrometer stages (D = diffusion stage, F = filter stage), allowing for particle sizing and counting.

FIG. 1 Schematic overview of the miniature DiSC: Aerosol is charged in a unipolar corona charger which controls the charging current, excess ions are removed in the ion trap, and the charged aerosol is measured in two electrometer stages (D = diffusion stage, F = filter stage), allowing for particle sizing and counting.

FIG. 2 The miniature DiSC, front (left), and with opened back cap (right). Visible components are (a) the inlet, (b) high voltage module, (c) unipolar charger, (d) filter stage, (e) battery, and (f) pump.
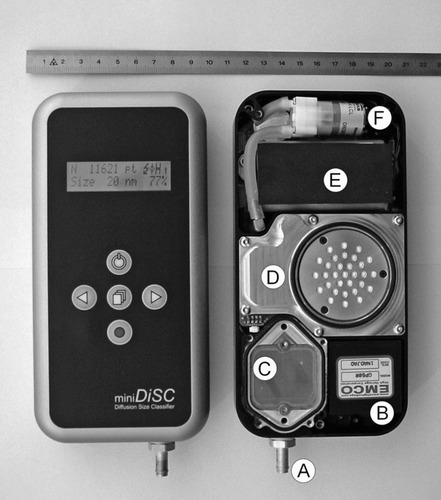
FIG. 2 The miniature DiSC, front (left), and with opened back cap (right). Visible components are (a) the inlet, (b) high voltage module, (c) unipolar charger, (d) filter stage, (e) battery, and (f) pump.

FIG. 3 Calibration setup for the miniature DiSC: a NaCl solution is nebulized, particles are size-selected in a DMA, neutralized, and then detected in parallel by the CPC and miniature DiSC.

FIG. 3 Calibration setup for the miniature DiSC: a NaCl solution is nebulized, particles are size-selected in a DMA, neutralized, and then detected in parallel by the CPC and miniature DiSC.

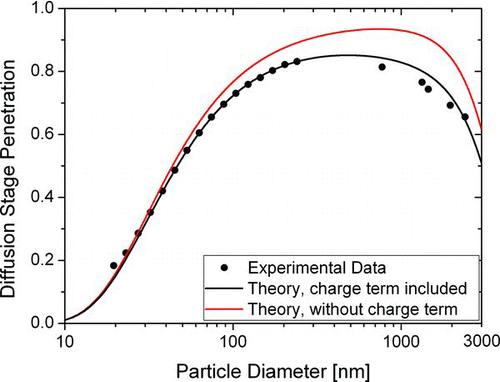
FIG. 4 Theoretical and experimental diffusion stage penetration. The theoretical curves are calculated with and without image charge effect. The diameter of maximal penetration d

is approximately 500 nm.

FIG. 4 Theoretical and experimental diffusion stage penetration. The theoretical curves are calculated with and without image charge effect. The diameter of maximal penetration dDisplay full size is approximately 500 nm.

TABLE 1 Computed miniature DiSC response to a lognormal aerosol size distribution (N= 1000 pt/cm3, d= 70 nm) with varying geometric standard deviation σ g

TABLE 2 Computed miniature DiSC response to bimodal lognormal aerosol size distribution with a fixed accumulation mode at 100 nm and a varying nucleation mode at 20 nm. The diameter reported for the particle size distribution is the geometric mean diameter

FIG. 5 Calculated sensitivity of the current ratio R for lognormal particle size distributions with given mode diameters and varying geometric standard deviation σ g .
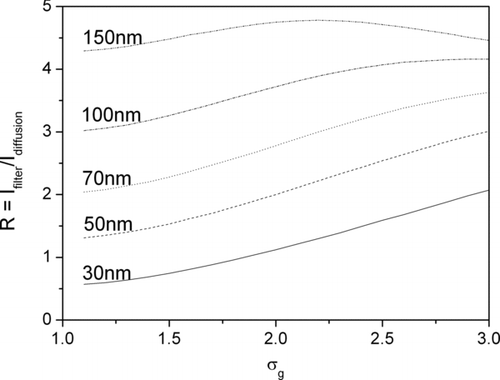
FIG. 5 Calculated sensitivity of the current ratio R for lognormal particle size distributions with given mode diameters and varying geometric standard deviation σ g .

FIG. 6 Lung-deposited surface area divided by total current as function of particle size. The instrument sensitivity in this example is approximately 0.65 μm2 cm−3 fA−1. With this simple approximation, errors remain smaller than ∼20% for particle sizes between 20 and 240 nm.
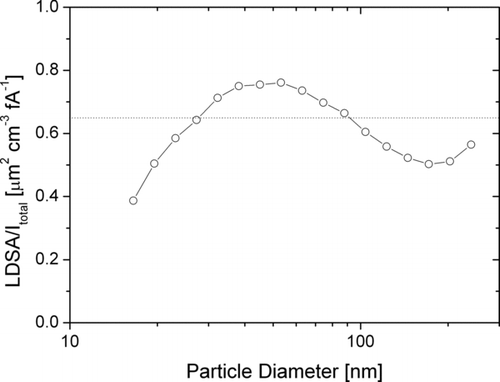
FIG. 6 Lung-deposited surface area divided by total current as function of particle size. The instrument sensitivity in this example is approximately 0.65 μm2 cm−3 fA−1. With this simple approximation, errors remain smaller than ∼20% for particle sizes between 20 and 240 nm.

FIG. 7 Calculated penetration of particles through the unipolar charger.

FIG. 7 Calculated penetration of particles through the unipolar charger.

FIG. 8 Experimentally determined charging efficiency as function of particle diameter; theoretical charging calculated according to Fuchs theory for an N i t-product of 4 × 10¹² m−3s, with and without calculated losses in the charger; and the power-law fit to the experimental data.
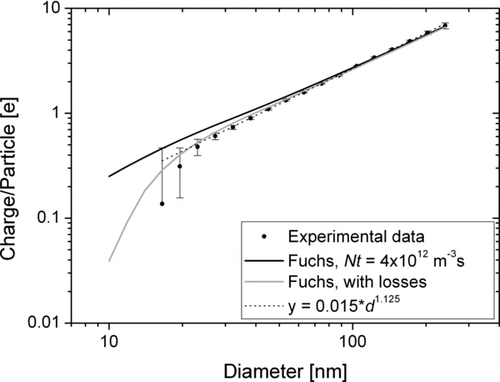
FIG. 8 Experimentally determined charging efficiency as function of particle diameter; theoretical charging calculated according to Fuchs theory for an N i t-product of 4 × 10¹² m−3s, with and without calculated losses in the charger; and the power-law fit to the experimental data.

FIG. 9 Corona voltage increase during 400 h of operation for 7 miniature DiSCs.

FIG. 9 Corona voltage increase during 400 h of operation for 7 miniature DiSCs.

FIG. 10 Electrometer signal as function of time during stationary sampling of HEPA-filtered air. The standard deviation of this sample is 0.145fA (approximately the average of our 16 samples), the average (zero offset) of the sample is –0.033fA.
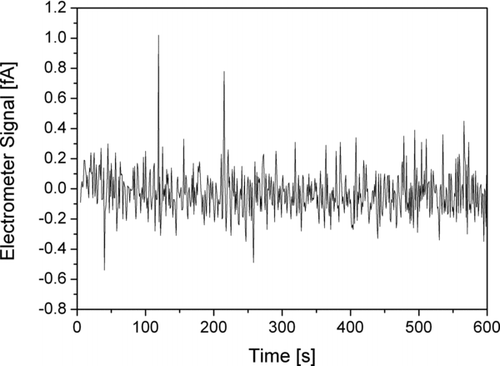
FIG. 10 Electrometer signal as function of time during stationary sampling of HEPA-filtered air. The standard deviation of this sample is 0.145fA (approximately the average of our 16 samples), the average (zero offset) of the sample is –0.033fA.

FIG. 11 Comparison of particle number concentration measured with a CPC and a miniature DiSC. Note that the CPC 3775 has a d50 cutoff diameter of 5 nm, and can thus detect more particles than the miniature DiSC.
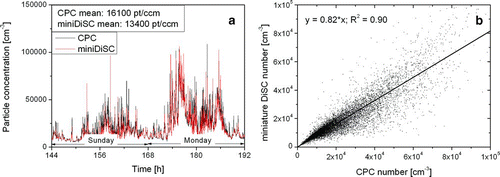
FIG. 11 Comparison of particle number concentration measured with a CPC and a miniature DiSC. Note that the CPC 3775 has a d50 cutoff diameter of 5 nm, and can thus detect more particles than the miniature DiSC.

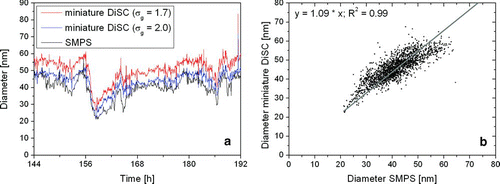
FIG. 12 (a) Comparison of particle number concentration for an SMPS system and a miniature DiSC. The miniature DiSC is calibrated once for σ g = 1.7 and once for σ g = 2.0; the difference in the particle number is hardly visible. (b) Correlation of the case σ g = 2.0 with the SMPS number concentration.
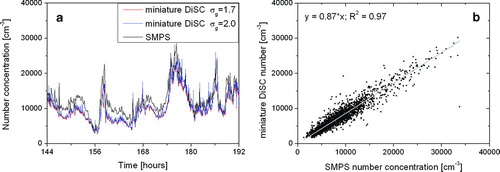
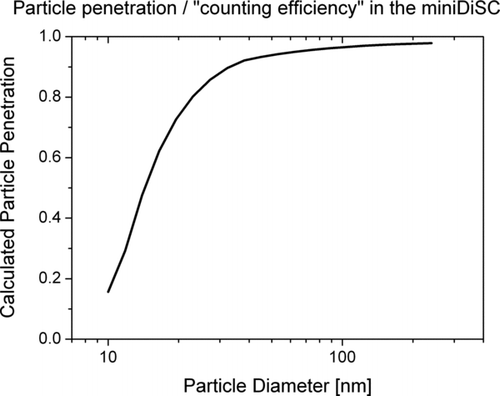
FIG. 12 (a) Comparison of particle number concentration for an SMPS system and a miniature DiSC. The miniature DiSC is calibrated once for σ g = 1.7 and once for σ g = 2.0; the difference in the particle number is hardly visible. (b) Correlation of the case σ g = 2.0 with the SMPS number concentration.
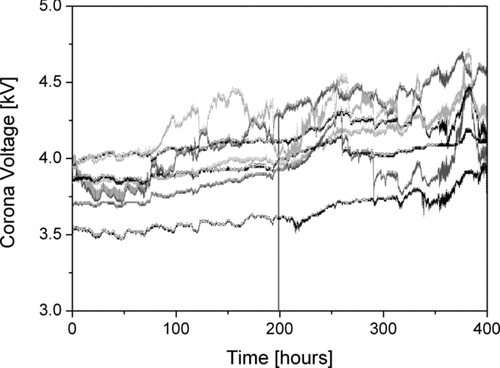
FIG. 13 (a) Comparison of the geometric mean diameter for an SMPS and the miniature DiSC with two different values of σ g for calibration (1.7 and 2.0) and (b) correlation of the diameters measured by SMPS and miniature DiSC for σ g = 2.0.

FIG. 13 (a) Comparison of the geometric mean diameter for an SMPS and the miniature DiSC with two different values of σ g for calibration (1.7 and 2.0) and (b) correlation of the diameters measured by SMPS and miniature DiSC for σ g = 2.0.

Reprints and Corporate Permissions

Please note: Selecting permissions does not provide access to the full text of the article, please see our help page How do I view content?

To request a reprint or corporate permissions for this article, please click on the relevant link below:

Academic Permissions

Please note: Selecting permissions does not provide access to the full text of the article, please see our help page How do I view content?

Obtain permissions instantly via Rightslink by clicking on the button below:

If you are unable to obtain permissions via Rightslink, please complete and submit this Permissions form. For more information, please visit our Permissions help page.