Figures & data
FIG. 1 Realistic airway tree geometry acquired using a Siemens Sensation 64 multi-detector row computed tomography (MDCT) scanner housed at the Iowa Comprehensive Lung Imaging Center at the University of Iowa.
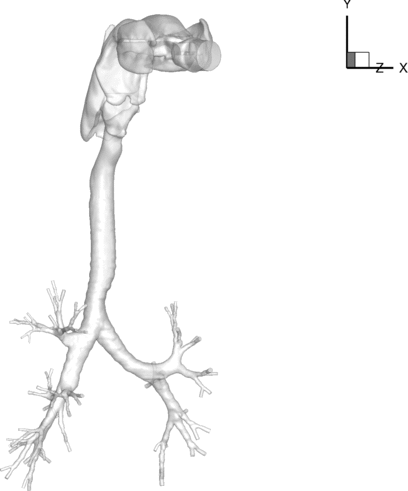
FIG. 2 A CT-based airway geometrical model with branch labels.
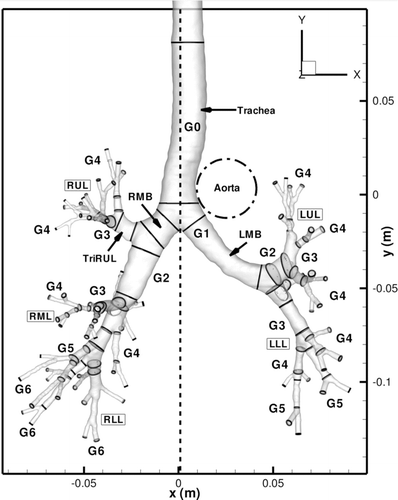
FIG. 3 Contours of (a) mean velocity (m/s) and (b) mean TKE (m2/s2) of the flow.
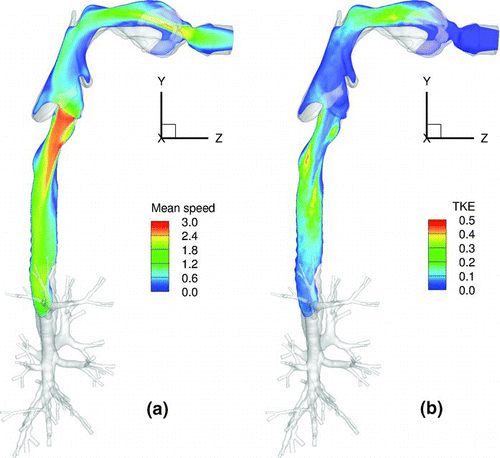
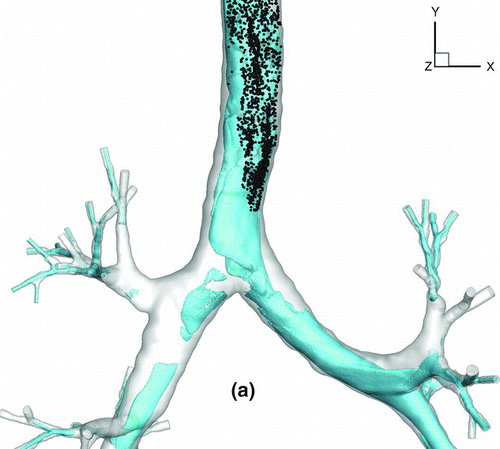
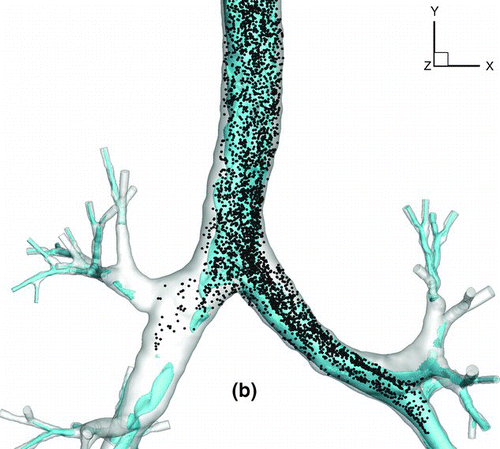
FIG. 4 Deposition locations for 2.5, 10, and 30-μm particles (left, middle, right).
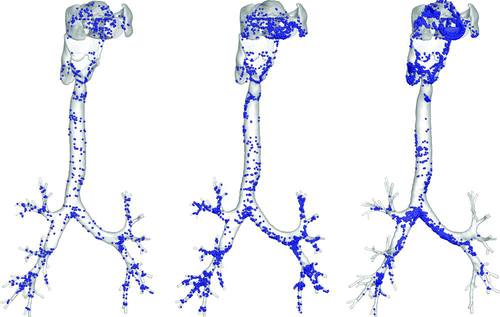
FIG. 5 Oral airway deposition patterns for 2.5, 10, and 30-μm particles with respective deposition efficiencies of 3.9%, 9.5%, and 75.0% (left, middle, right).
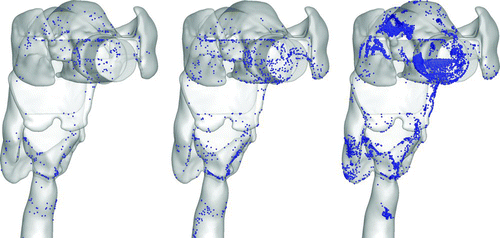
FIG. 6 Overall deposition efficiency vs. (a) particle size and (b) particle Stokes number for original and refined meshes.
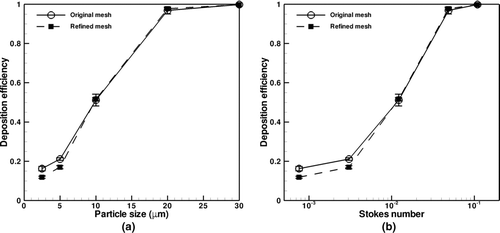
FIG. 7 Oral deposition efficiency vs. (a) particle size and (b) particle Stokes number for original and refined meshes.
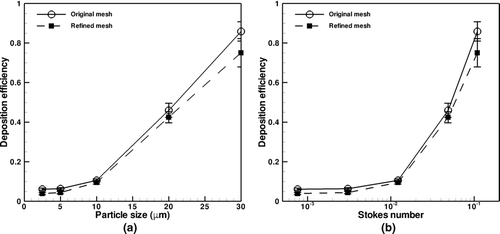
FIG. 8 Comparison of oral deposition results to CitationGrigic et al. (2004).
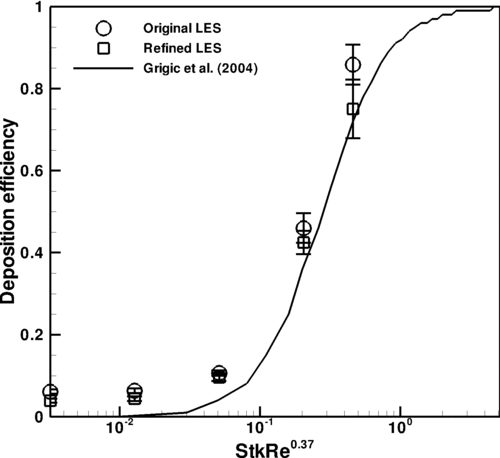
FIG. 9 Deposition efficiency for the first generation.
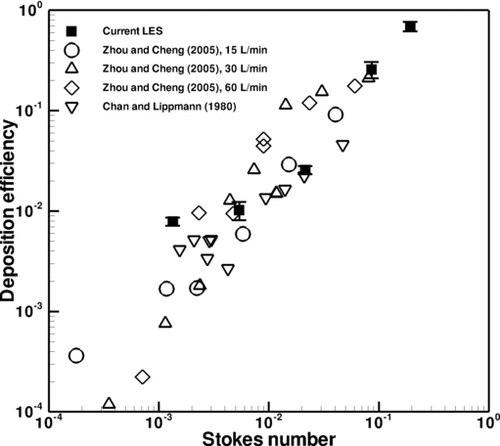
FIG. 10 Deposition efficiency in the second generation. Different symbols in the current LES denote different bifurcations.
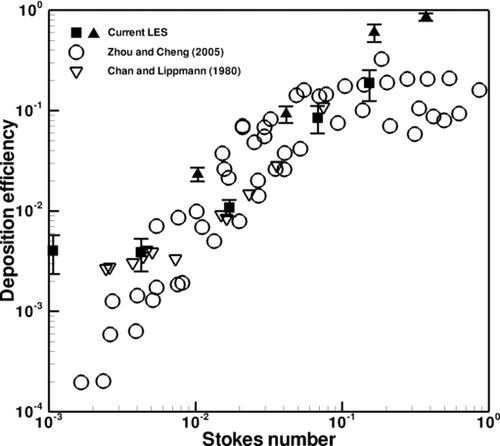
FIG. 11 Deposition efficiency in the third generation. Different symbols in the current LES denote different bifurcations.
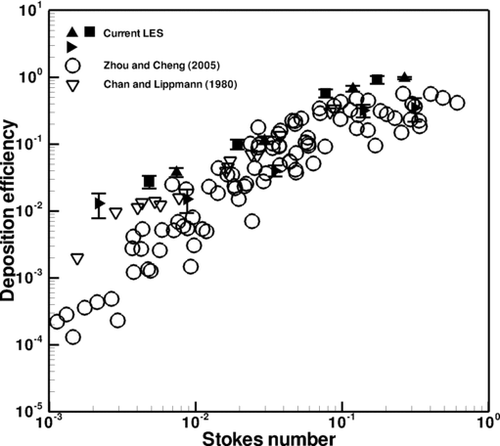
FIG. 12 Deposition efficiency in the fourth generation. Different symbols in the current LES denote different bifurcations.
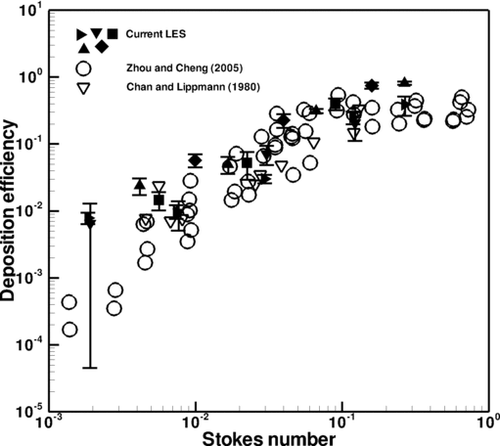
FIG. 13 Lobar (a) deposition and (b) ventilation of 2.5, 5, 10, 20, and 30-μm particles.
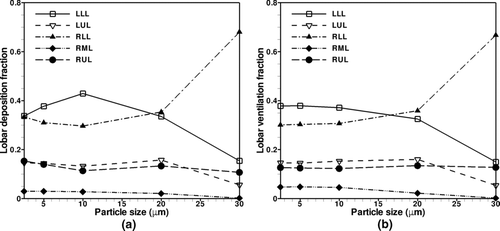
TABLE 1 Lobar deposition for 2.5 and 5.0-μm particles compared against 4.0-μm particles from CitationSubramaniam et al. (2003)
TABLE 2 Deposition ratio between upper (U) to lower lobes (L) U/L, for the right and left lungs (note that the RML is not included in the calculation; +/– denotes standard deviation)
FIG. 14 Left vs. right lung (a) deposition and (b) ventilation of 2.5, 5, 10, 20, 30-μm particles.
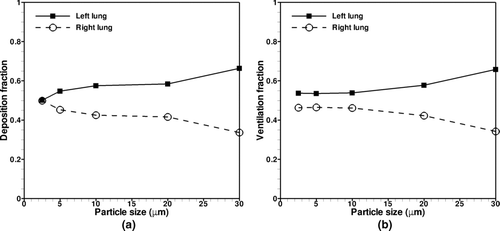
FIG. 15 L/R ratio vs. Stokes number at the trachea and glottis.
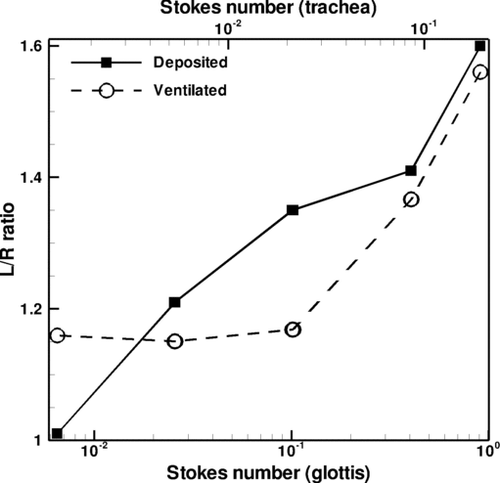
TABLE 3 Left lung (L) over right lung (R) ratio for 2.5, 5, 10, 20, and 30-μm particles, +/– denotes standard deviation
FIG. 16 Particle transport profiles at normalized time t* = 0.13. (a) 2.5-μm particles with Stkglottis= 0.006, (b) 20-μm particles with Stkglottis= 0.405. The unit of air speed is m/s.
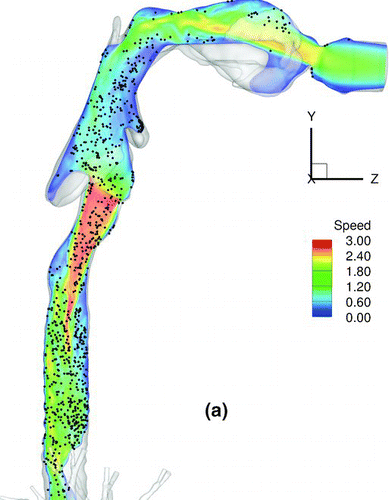
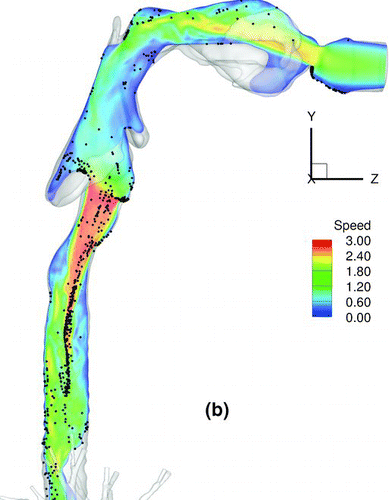
FIG. 17 Iso-surfaces of air speed of 1.58 m/s and particle transport profile for 2.5-μm particles at (a) t* = 0.11, (b) t* = 0.13.