1,421
Views
47
CrossRef citations to date
0
Altmetric
Regular Articles

Characterization of a Newly Developed Aircraft-Based Laser Ablation Aerosol Mass Spectrometer (ALABAMA) and First Field Deployment in Urban Pollution Plumes over Paris During MEGAPOLI 2009

, , , , , , , , , , , & show all
Pages 46-64 | Received 30 Apr 2010, Accepted 12 Aug 2010, Published online: 09 Jun 2011

Figures & data

FIG. 1 Left: photograph of the ALABAMA rack. Main components are labelled. Right: schematic of the vacuum chamber section including aerodynamic lens, detection and sizing region and mass spectrometer. TMP: turbomolecular pump.
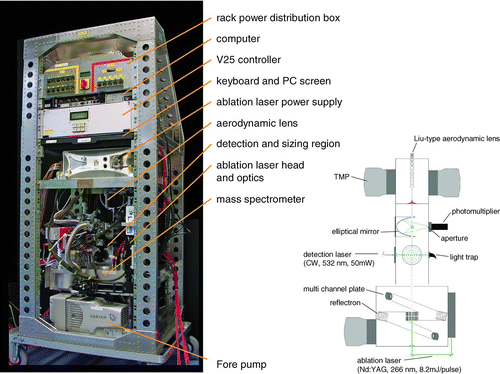
FIG. 1 Left: photograph of the ALABAMA rack. Main components are labelled. Right: schematic of the vacuum chamber section including aerodynamic lens, detection and sizing region and mass spectrometer. TMP: turbomolecular pump.

FIG. 2 Schematic drawing of the pressure controlled inlet (PCI).

FIG. 2 Schematic drawing of the pressure controlled inlet (PCI).

FIG. 3 Drawing of the detection system of the scattered light using an elliptical mirror. F1, F2: focal points, PMT: photomultiplier tube. The detection laser hits the particle in the first focal point. The light scattered into the range between –R° and +F° is detected by the PMT behind the second focal point. The angular range –R° and +F° is axis-symmetric with respect to the axis F1 – F2.
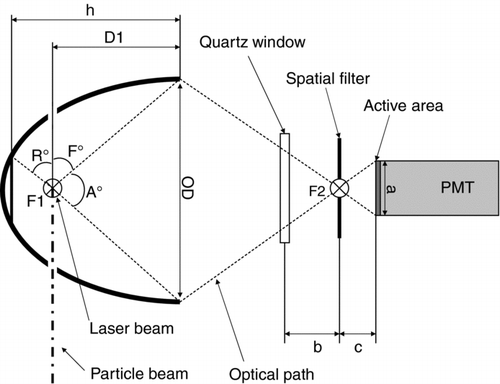
FIG. 3 Drawing of the detection system of the scattered light using an elliptical mirror. F1, F2: focal points, PMT: photomultiplier tube. The detection laser hits the particle in the first focal point. The light scattered into the range between –R° and +F° is detected by the PMT behind the second focal point. The angular range –R° and +F° is axis-symmetric with respect to the axis F1 – F2.

FIG. 4 Schematic drawing of the optical system of the ablation laser.

FIG. 4 Schematic drawing of the optical system of the ablation laser.

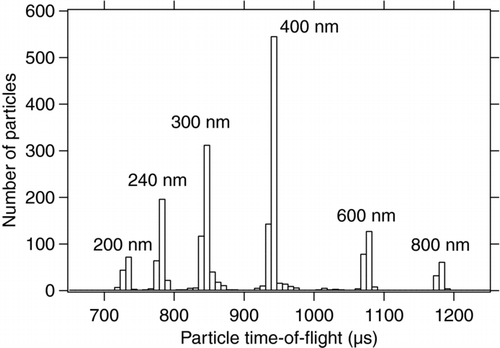
FIG. 5 Histogram of flight times for PSL particles of different diameters

FIG. 5 Histogram of flight times for PSL particles of different diameters

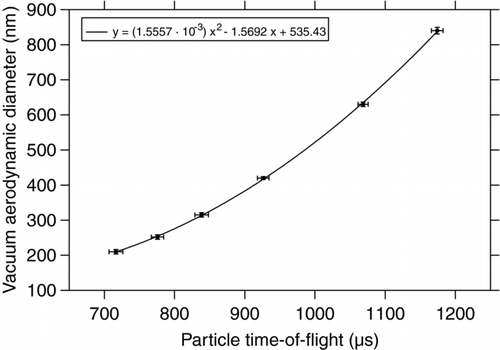
FIG. 6 Particle size calibration: vacuum aerodynamic diameter vs. particle time-of-flight.

FIG. 6 Particle size calibration: vacuum aerodynamic diameter vs. particle time-of-flight.

FIG. 7 Detection efficiencies for several particles types and diameters. (Error bars: counting statistics.)
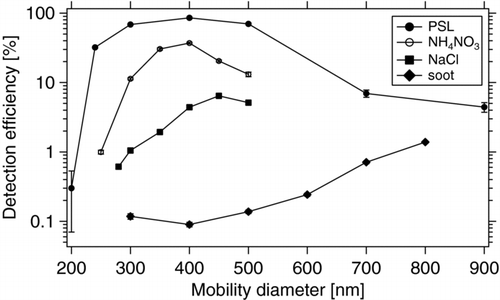
FIG. 7 Detection efficiencies for several particles types and diameters. (Error bars: counting statistics.)

FIG. 8 Particle beam axis position for different particle types and diameters (Error bars: counting statistics.)
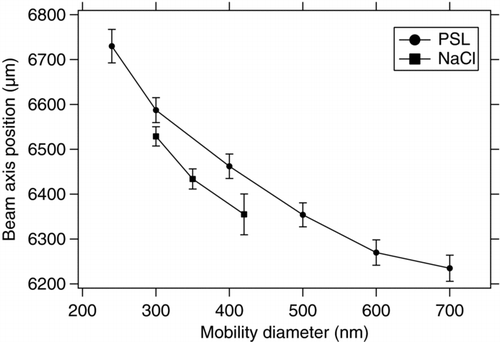
FIG. 8 Particle beam axis position for different particle types and diameters (Error bars: counting statistics.)

FIG. 9 Ablation efficiency for PSL and NaCl at two different laser ablation focal diameters (280 and 700 μm).
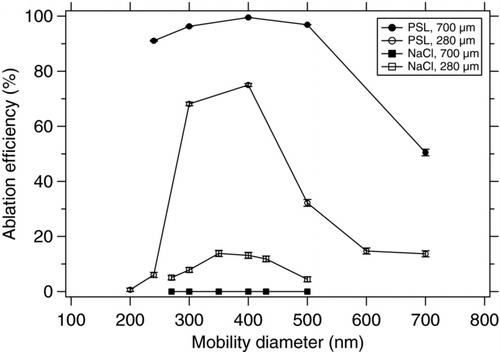
FIG. 9 Ablation efficiency for PSL and NaCl at two different laser ablation focal diameters (280 and 700 μm).

FIG. 10 Excerpt of a mass spectrum of a single PSL particle, coated with lead acetate (Pb(CH3COO)2). The three isotopes of lead at m/z 206, 207, and 208 are clearly separated.
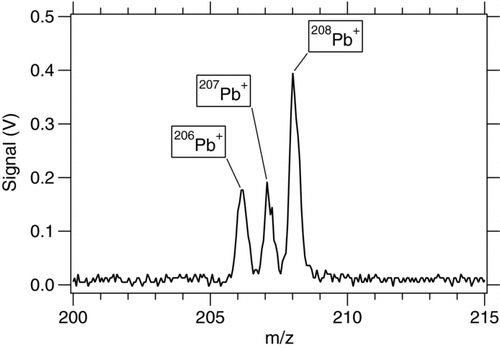
FIG. 10 Excerpt of a mass spectrum of a single PSL particle, coated with lead acetate (Pb(CH3COO)2). The three isotopes of lead at m/z 206, 207, and 208 are clearly separated.

FIG. 11 Example mass spectra for various organic and inorganic aerosol particles. Left: positive ions, right: negative ions. (a) 1,4-Benzenediamine (p-Phenylendiamine), (b) acetic acid, (c) ammonium nitrate, (d) ammonium sulfate.
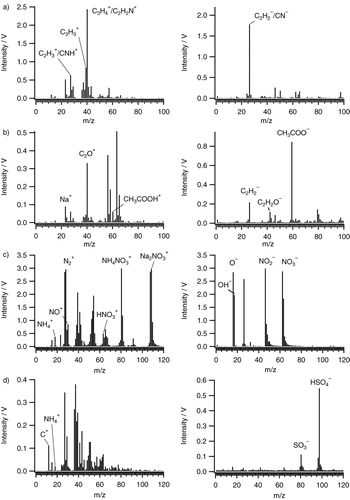
FIG. 11 Example mass spectra for various organic and inorganic aerosol particles. Left: positive ions, right: negative ions. (a) 1,4-Benzenediamine (p-Phenylendiamine), (b) acetic acid, (c) ammonium nitrate, (d) ammonium sulfate.

FIG. 12 ALABAMA ablation efficiency and vertical aircraft acceleration during measurement flight on 1 July 2009.
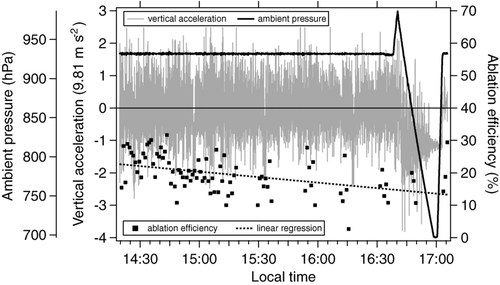
FIG. 12 ALABAMA ablation efficiency and vertical aircraft acceleration during measurement flight on 1 July 2009.

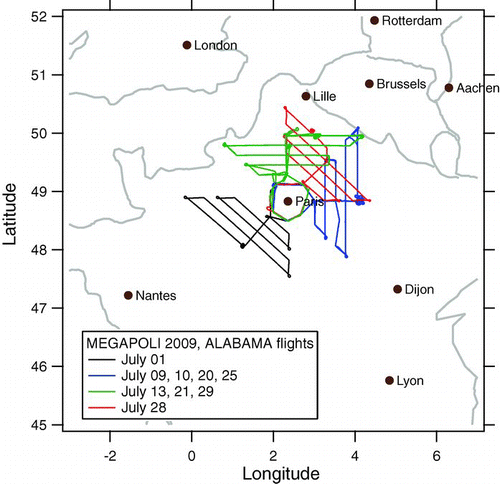
FIG. 13 Flight tracks of the ALABAMA flights during MEGAPOLI summer, July 2009.

FIG. 13 Flight tracks of the ALABAMA flights during MEGAPOLI summer, July 2009.

FIG. 14 48 h backward trajectories, calculated with HYSPLIT, end point Paris, 800 m above ground. End times: 6:00, 9:00, 12:00, 15:00, and 18:00 (UTC) for each flight day.
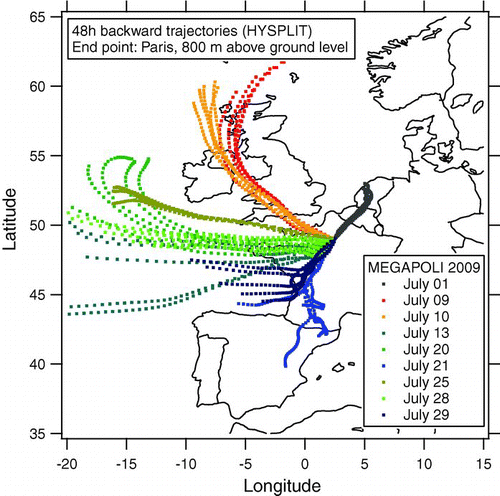
FIG. 14 48 h backward trajectories, calculated with HYSPLIT, end point Paris, 800 m above ground. End times: 6:00, 9:00, 12:00, 15:00, and 18:00 (UTC) for each flight day.

FIG. 15 Typical single particle mass spectra for the eight major particle classes. Peaks used for the classification are marked.
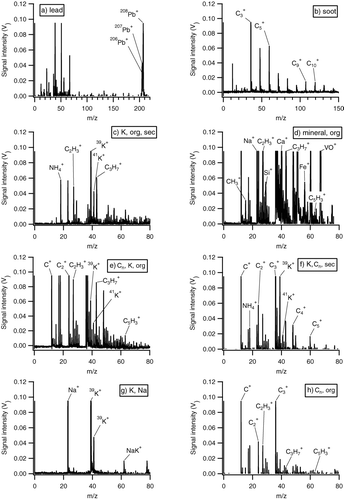
FIG. 15 Typical single particle mass spectra for the eight major particle classes. Peaks used for the classification are marked.

TABLE 1 Characteristic peaks for the eight identified particle classes

FIG. 16 Relative (and absolute) abundance of particle classes during all flights that sampled air from the Paris megacity area (left) and during the flight on July 1 when air masses arrived from North-East (right).
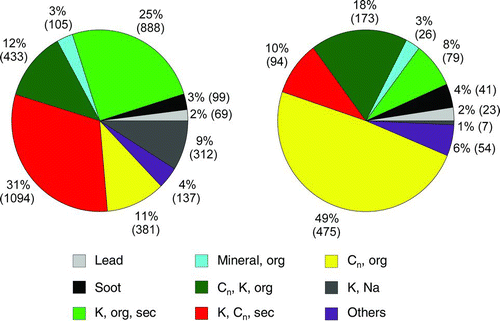
FIG. 16 Relative (and absolute) abundance of particle classes during all flights that sampled air from the Paris megacity area (left) and during the flight on July 1 when air masses arrived from North-East (right).

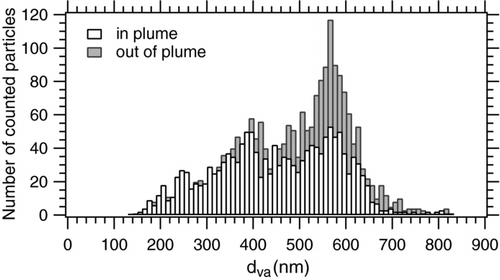
FIG. 17 Size distribution of particles measured with ALABAMA, in and out of the Paris plume.

FIG. 17 Size distribution of particles measured with ALABAMA, in and out of the Paris plume.

FIG. 18 Relative abundance of particle classes for flights sampling the Paris plume. Left: complete data set, middle: inside plume: right: outside plume. (a) all particle sizes, (b) d > 450 nm, (c) d < 450 nm.
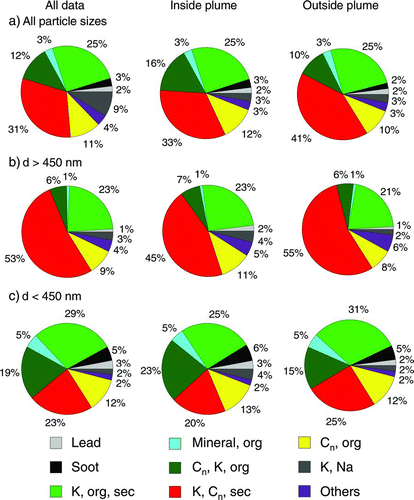
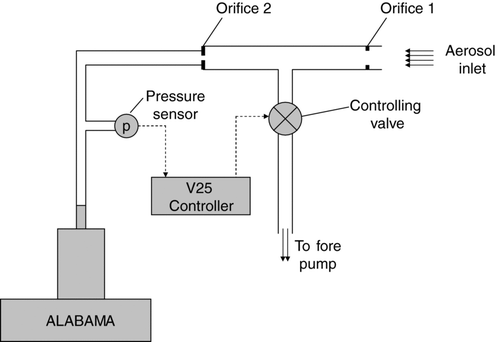
FIG. 18 Relative abundance of particle classes for flights sampling the Paris plume. Left: complete data set, middle: inside plume: right: outside plume. (a) all particle sizes, (b) d > 450 nm, (c) d < 450 nm.
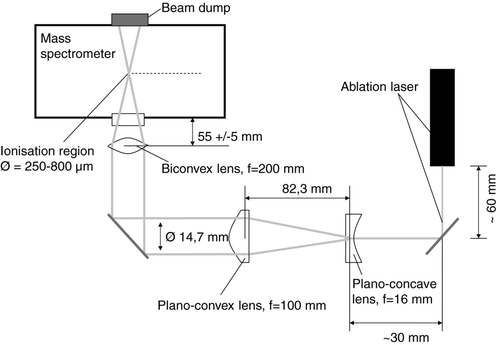
TABLE 2 Comparison between ALABAMA and other existing aircraft-based laser ablation aerosol mass spectrometers

Reprints and Corporate Permissions

Please note: Selecting permissions does not provide access to the full text of the article, please see our help page How do I view content?

To request a reprint or corporate permissions for this article, please click on the relevant link below:

Academic Permissions

Please note: Selecting permissions does not provide access to the full text of the article, please see our help page How do I view content?

Obtain permissions instantly via Rightslink by clicking on the button below:

If you are unable to obtain permissions via Rightslink, please complete and submit this Permissions form. For more information, please visit our Permissions help page.