Figures & data
FIG. 1 An example of estimations based on the classical theory applied to the arithmetic mean fiber diameter for one of the filters (N6) used in experiments. (a) Effect of particle diameter on the single fiber deposition efficiencies of nanoparticles for various deposition mechanisms: Brownian diffusion (ED ), action of image force for a singly-charged particle and a neutral fiber (EIF ), and direct interception (ER ); (b) relative contribution of Brownian diffusion to the overall single fiber deposition efficiency for the range of particle sizes studied experimentally.
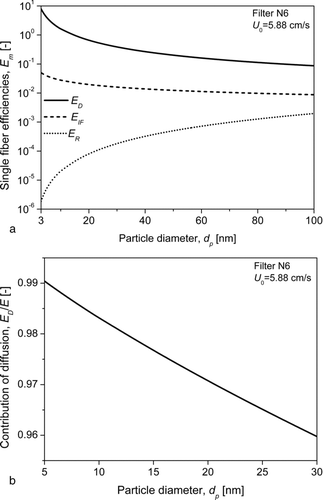
FIG. 2 System of fibrous filter production (a), the die structure (b), and single fiber formation (c).
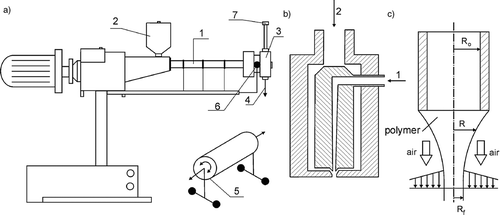
TABLE 1 Summary of filters’ structural parameters
FIG. 3 SEM images of the tested filters: (a) N1, (b) N6, (c) F1, and (d) F3.
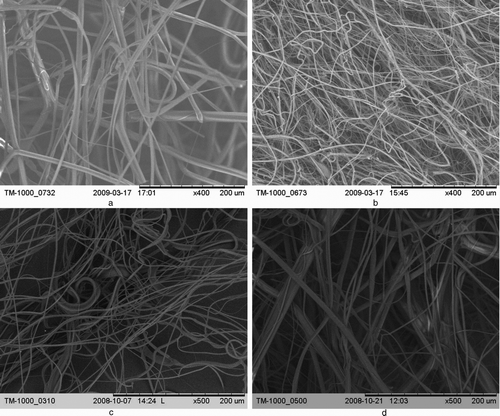
FIG. 4 Normalized cumulative log-normal distributions of fibers’ diameters for investigated filters.
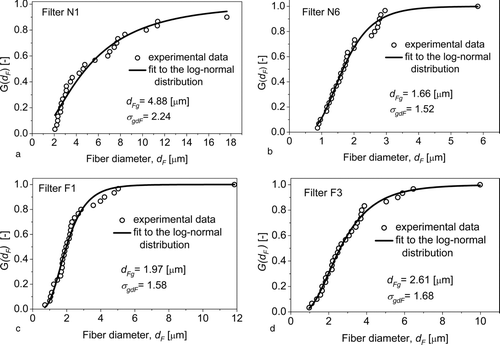
TABLE 2 Materials used for filter penetration measurements (all from Sigma Aldrich)
FIG. 5 Experimental arrangement.
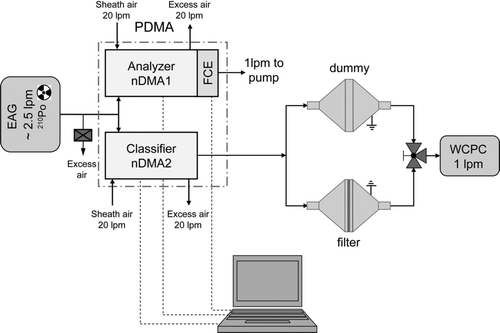
FIG. 6 Size spectra of Enolase, Ferritin and AS-40 silica particles exiting the classifier DMA – nDMA2.
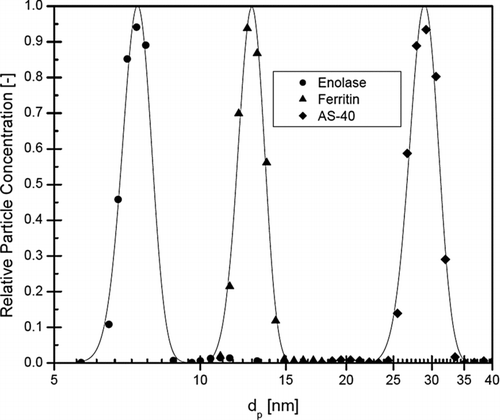
TABLE 3 Summary of experimentally measured penetrations
TABLE 4 Values of the segregation intensity, s, as a function of the Peclet number, Pe, determined from experimental data using the PSFM
FIG. 7 Log-logistic (solid lines) and log-normal (dotted lines) approximations of the segregation intensity, s, versus the Peclet number, Pe, based on the arithmetic mean fiber diameter for four examined filters.
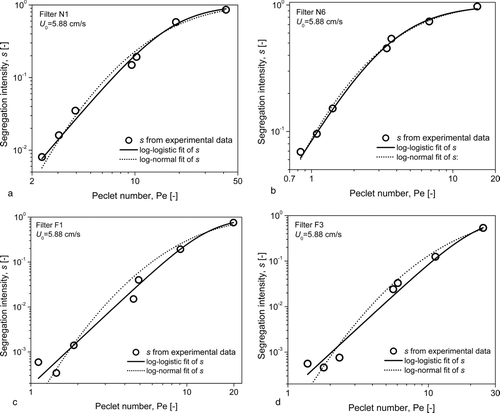
TABLE 5 Parameters of the fitting functions s(Pe) and the coefficients of determination, R2
FIG. 8 Comparison of experimental data of penetration (points) with PSFM used in line with the log-logistic approximation s (Pe)—solid lines, and with the classical theory applied to the arithmetic mean fiber diameter—dotted lines.
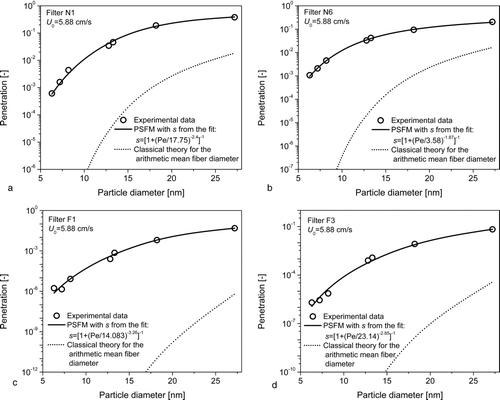
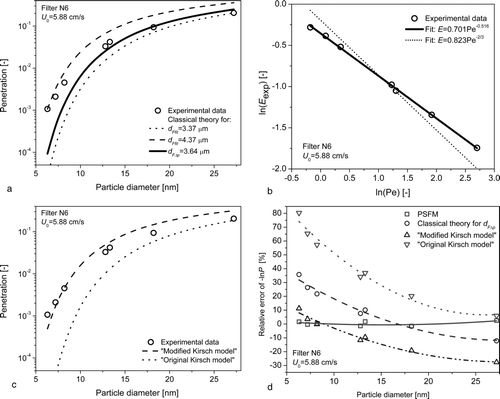
FIG. 9 Analysis of results for the filter N6: (a) an attempt of application of the classical theory for two fitted fiber diameters: dFfit = 3.37 μm (dotted line) and dFfit = 4.37 μm (dashed line), and for the pressure drop equivalent diameter d FΔp = 3.64 μm (solid line); (b) interpolation of experimental values of the single fiber efficiency by the power function of the Peclet number: solid line—free exponent of the Peclet number, dotted line—fixed exponent of the Peclet number (=−2/3); (c) comparison of experimental data with the “original” and “modified” Kirsch model; (d) relative errors (indicated by symbols) of calculation of –ln P for various models.