7,151
Views
95
CrossRef citations to date
0
Altmetric
Original Articles

Particle Image Velocimetry of Human Cough

, &
Pages 415-422 | Received 12 Jun 2010, Accepted 05 Nov 2010, Published online: 03 Jan 2011

Figures & data

FIG. 1 Diagram of apparatus.

FIG. 1 Diagram of apparatus.

FIG. 2 Diagram depicting timing of image frames for PIV measurements.

FIG. 2 Diagram depicting timing of image frames for PIV measurements.

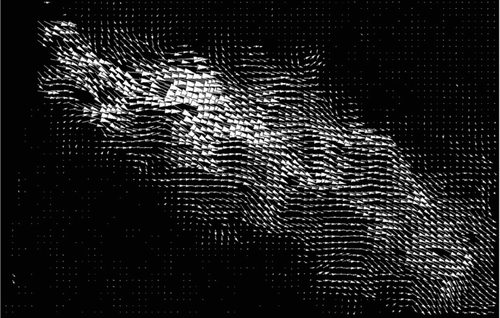
FIG. 3 PIV of cough flow using theatrical fog.

FIG. 3 PIV of cough flow using theatrical fog.

TABLE 1 Characteristic cough volumetric flow rates from CitationMahajan et al. (1994) and CitationSingh et al. (1995); corresponding average velocities based on diameter D= 30 mm

FIG. 4 Average waveform of a cough. Error bars are the standard deviation of the measurement (n= 145). Distribution statistics and an exponential fit to the data are given.
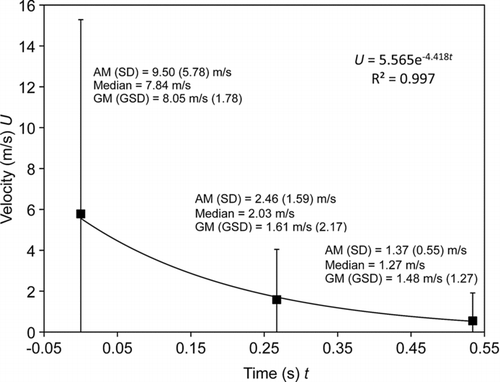
FIG. 4 Average waveform of a cough. Error bars are the standard deviation of the measurement (n= 145). Distribution statistics and an exponential fit to the data are given.

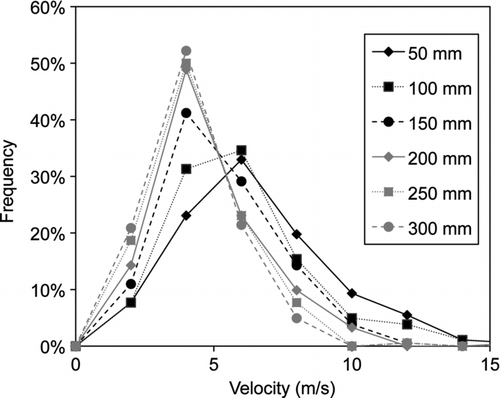
FIG. 5 Distribution of maximum velocity of each cough at specified locations in x.

FIG. 5 Distribution of maximum velocity of each cough at specified locations in x.

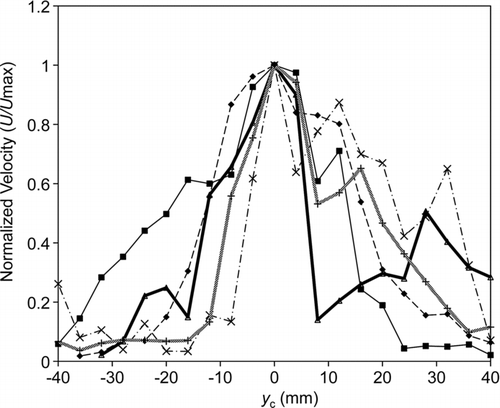
FIG. 6 Offset velocity profiles for five representative coughs at x= 50 mm.

FIG. 6 Offset velocity profiles for five representative coughs at x= 50 mm.

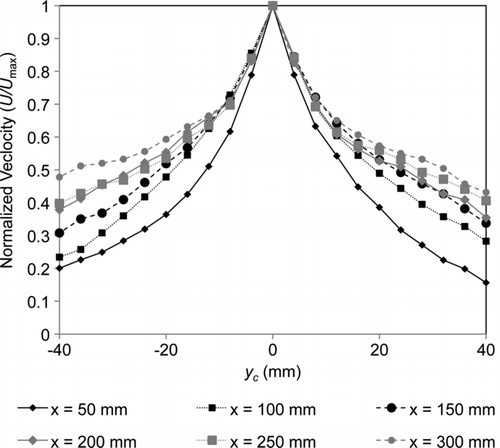
FIG. 7 Normalized velocity profiles for each x location, averaged over all coughs.

FIG. 7 Normalized velocity profiles for each x location, averaged over all coughs.

FIG. 8 Average lower y and upper y locations for 1/2 of centerline velocity. The width, d, was determined from the difference between the upper and lower half velocity locations, then averaged over all coughs (). Error bars are the standard deviation.
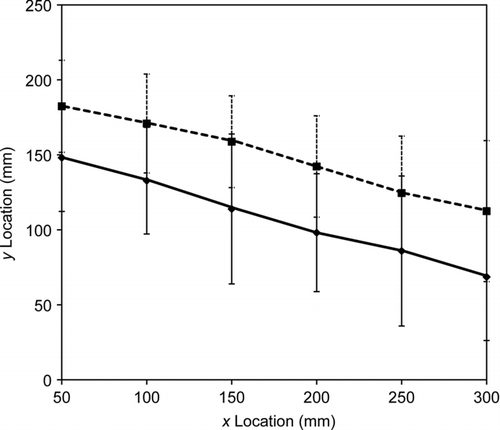
FIG. 8 Average lower y and upper y locations for 1/2 of centerline velocity. The width, d, was determined from the difference between the upper and lower half velocity locations, then averaged over all coughs (Figure 9). Error bars are the standard deviation.

FIG. 9 Average and standard deviation of the cough flow width as a function of the X distance from mouth.
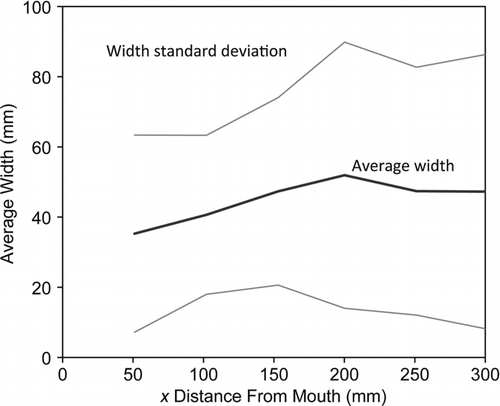
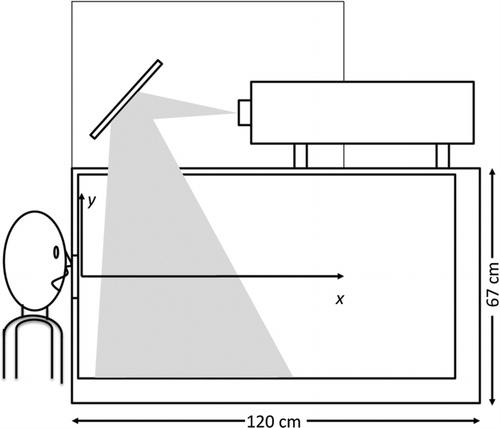
FIG. 9 Average and standard deviation of the cough flow width as a function of the X distance from mouth.
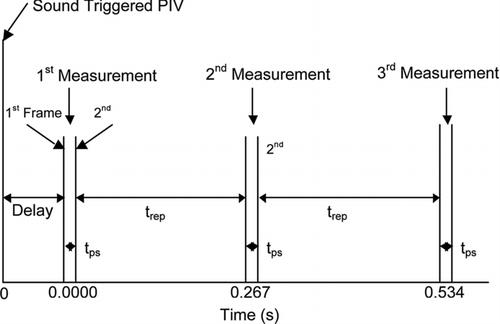
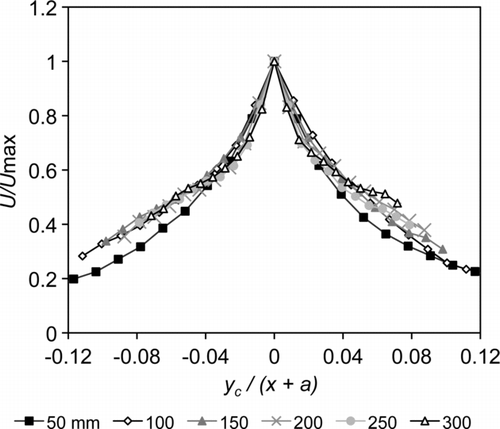
FIG. 10 Normalized velocity profiles scaled by x + a.

FIG. 10 Normalized velocity profiles scaled by x + a.

Reprints and Corporate Permissions

Please note: Selecting permissions does not provide access to the full text of the article, please see our help page How do I view content?

To request a reprint or corporate permissions for this article, please click on the relevant link below:

Academic Permissions

Please note: Selecting permissions does not provide access to the full text of the article, please see our help page How do I view content?

Obtain permissions instantly via Rightslink by clicking on the button below:

If you are unable to obtain permissions via Rightslink, please complete and submit this Permissions form. For more information, please visit our Permissions help page.