Figures & data
FIG. 1 Nocturnal particle formation in Hyytiälä, May 19–24, 2008. (a) Neutral nano-CN concentration (black line), intermediate (1.3–3.2 nm positive + negative) ion concentration multiplied by 100 (dots), and solar angle (thin line, right axis). (b) Charged fraction of 1–3 nm nano-CN (black dots), and its median value of the whole May 2008 as a horizontal line.
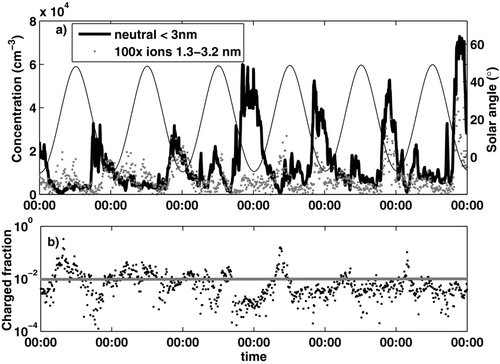
TABLE 1 Frequency of nocturnal events detected with the PH-CPC (neutral) and the BSMA (ions) in May. Events/all days, when data was available
FIG. 2 Particle size distributions measured with the (a) PH-CPC (1.3–5 nm, neutral), (b) DMPS (3–1000 nm, total), (c) BSMA (0.8–5 nm, negative ions), and (d) BSMA (0.8–5 nm, positive ions) in Hyytiälä, May 3, 2008.
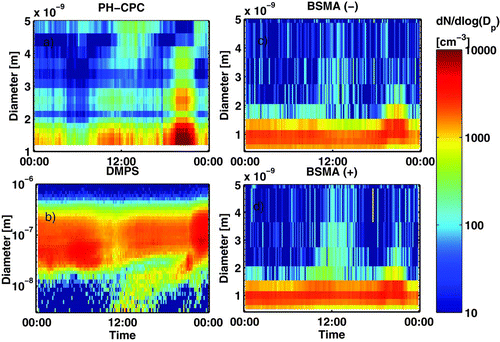
FIG. 3 Median diurnal variation of (a) neutral nano-CN (right axis) and small ions (left axis), (b) the mean mobility of the ions, and (c) charged fraction of the nano-CN in Hyytiälä in May 2008.
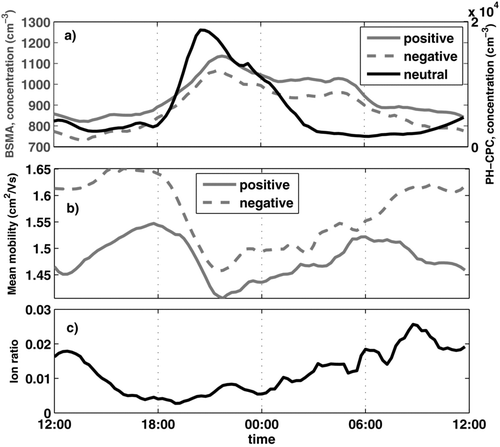
FIG. 4 Conditions favoring night-time nano-CN formation. Median diurnal variation in May 2008 separately for event (black line) and non-event nights (gray dashed line). Note the atypical time axis.
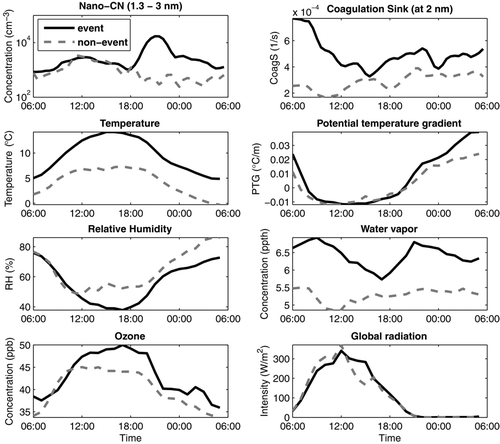
FIG. 5 PH-CPC raw data at the flow tube experiments. Average count rate per channel number at different initial concentration of limonene. The vertical line represents the peak channel of the homogenous nucleation mode (pulse counts for [Limonene]initial = 0 cm−3 result from homogeneous nucleation). Typical night-time field data (average of 4 h, scaled to same channel axis) as thick black line. All particles larger than about 5 nm accumulate around channel 670.
![FIG. 5 PH-CPC raw data at the flow tube experiments. Average count rate per channel number at different initial concentration of limonene. The vertical line represents the peak channel of the homogenous nucleation mode (pulse counts for [Limonene]initial = 0 cm−3 result from homogeneous nucleation). Typical night-time field data (average of 4 h, scaled to same channel axis) as thick black line. All particles larger than about 5 nm accumulate around channel 670.](/cms/asset/8aa2ee42-3719-4ed6-94f6-c0b638486662/uast_a_547537_o_f0005g.gif)
FIG. 6 Nano-CN concentration detected by the PH-CPC at flow tube experiments with different concentrations of limonene and α-pinene reacted with ozone. Lines are linear fittings to the data.
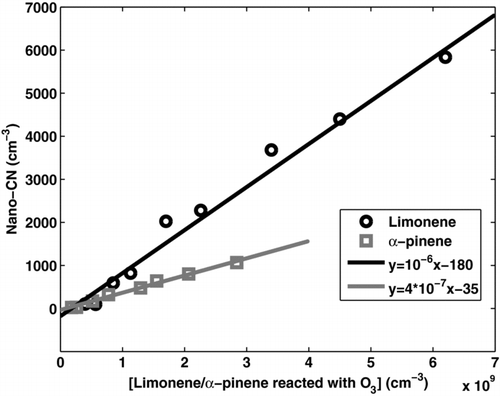
FIG. 7 Correlation between the monoterpene oxidation products and the nano-CN concentration in Hyytiälä separately for daytime (06:00–18:00) and night-time (18:00–6:00) values. Lines are linear fittings to the data on a logarithmic scale.
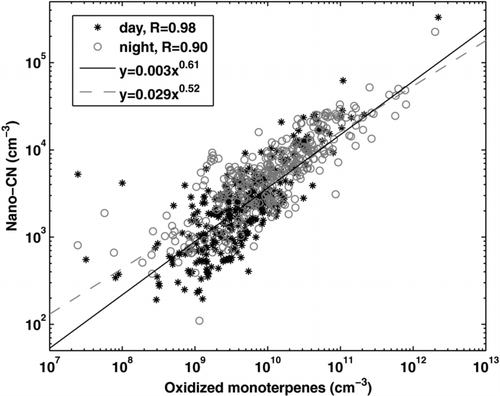
FIG. 8 Diurnal pattern of mass 97 Th (sulphuric acid monomer, HSO− 4) and mass 340 Th (possibly C10H14NO− 12, Ehn at al. 2010) separately on days with a nocturnal event (solid line), an ion event (dotted line with crosses), or no event (dashed line).
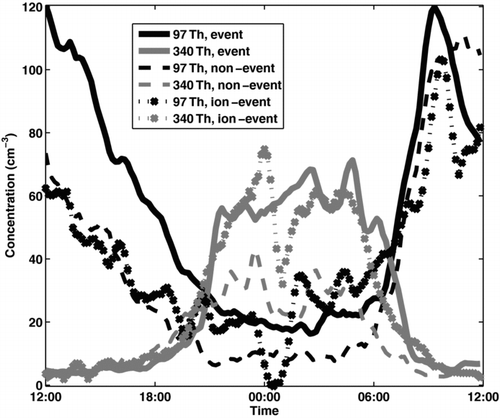
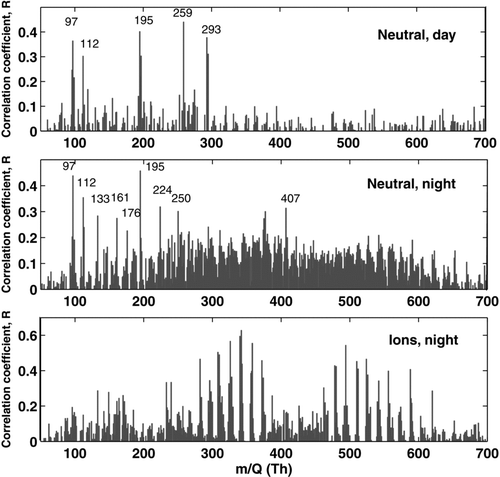
FIG. 9 Time series correlogram of the negative masses detected by the APi-ToF and the concentration of nano-CN measured by PH-CPC (neutral) or BSMA (ions) April 29–May 26, 2009. Daytime was defined as 06:00–18:00, and night-time 18:00–6:00.