Figures & data
TABLE 1 Properties of the base diesel fuel and the biodiesel 10% vol. (B10) blends. The feedstock used for each B10 blend shown on the first row of the table
FIG. 1 Schematic of the setup employed for the measurement of airborne particle properties.
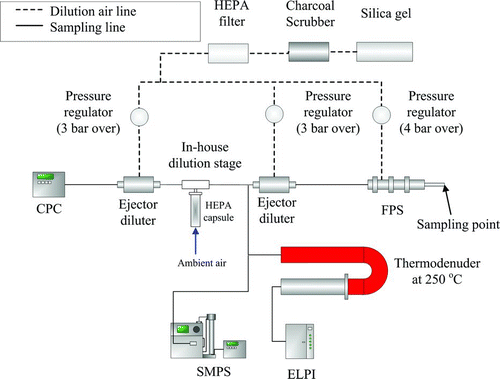
TABLE 2 Details of the aerosol sampling system
FIG. 2 Particle size distributions at 50 km/h. (a) Normalized current-weighted size distributions of non-volatile particles measured by the ELPI. Error bars correspond to min-max of measured range. (b) Number-weighted size distribution of total particles measured by the SMPS.
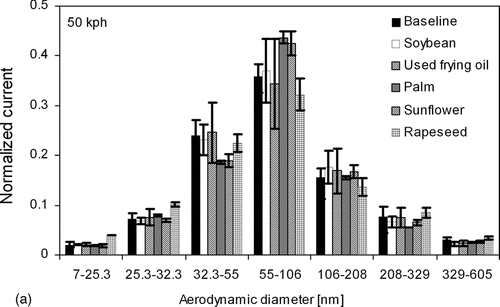
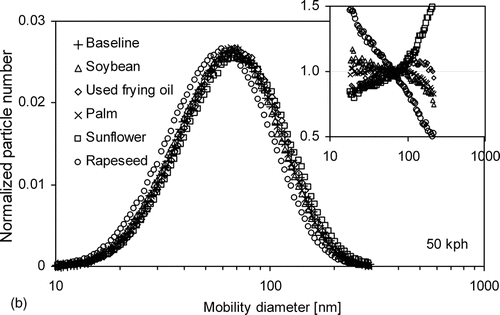
TABLE 3 Estimated fractal dimension (DF) for the various blends
FIG. 3 Particle number emissions over all cycles and steady state tests. Empty symbols correspond to tests with moderate speed/load. Solid symbols represent high speed testing (Artemis Motorway and 120 km/h).
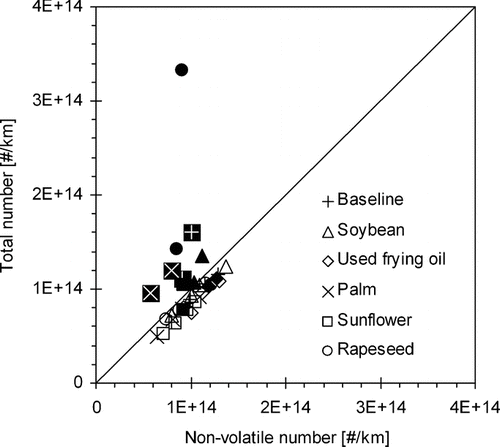
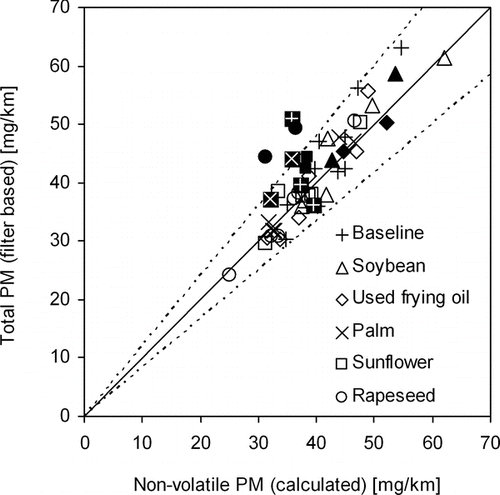
FIG. 4 Particle mass emissions over all cycles. Empty symbols correspond to tests with moderate speed/load. Solid symbols correspond to Artemis Motorway.