Figures & data
FIG. 1 Physical representation of the probability distribution of induced and intrinsic aggregate distributions from ES.
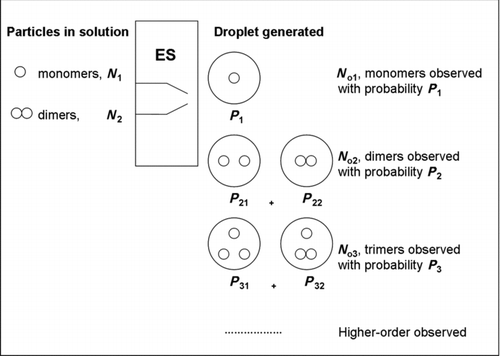
FIG. 2 (a) ES monomodal and narrow droplet size distribution [20 mmol ammonium acetate (Am Ac) with the chamber pressure in ES at PSI 3.7 (2.55 × 10⁴ Pa) and a carrier gas in ES of 1 L/min purified air and 0.2 L/min carbon dioxide] for Rituxan samples in Sections 4.1.1 and 4.2. (b) ES droplet with a bimodal size distribution (2 mmol ammonium acetate (Am Ac) with the chamber pressure in ES at PSI 3.7 (2.55 × 10⁴ Pa) and a carrier gas in ES of 1 L/min purified air and 0.2 L/min carbon dioxide) for Au-NPs Samples 1 and 2 in Section 4.3.
![FIG. 2 (a) ES monomodal and narrow droplet size distribution [20 mmol ammonium acetate (Am Ac) with the chamber pressure in ES at PSI 3.7 (2.55 × 10⁴ Pa) and a carrier gas in ES of 1 L/min purified air and 0.2 L/min carbon dioxide] for Rituxan samples in Sections 4.1.1 and 4.2. (b) ES droplet with a bimodal size distribution (2 mmol ammonium acetate (Am Ac) with the chamber pressure in ES at PSI 3.7 (2.55 × 10⁴ Pa) and a carrier gas in ES of 1 L/min purified air and 0.2 L/min carbon dioxide) for Au-NPs Samples 1 and 2 in Section 4.3.](/cms/asset/74ed4732-5651-477f-b10e-566dbfaf3cba/uast_a_566901_o_f0002g.gif)
FIG. 3 ES monomodal and narrow droplet size distribution (20 mmol ammonium acetate (Am Ac) with the chamber pressure in ES at PSI 3.7 (2.55 × 10⁴ Pa) and a carrier gas in ES of 1 L/min purified air and 0.2 L/min carbon dioxide). The monomodal approximation can be improved by using three average droplet volumes in three regions and solving EquationEquations (25) and Equation(26).
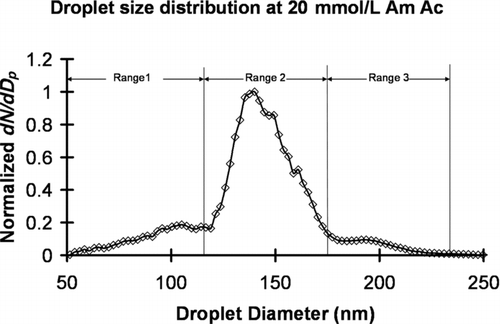
FIG. 4 The observed ES-DMA size distributions of Rituxan concentration at 5 μg/mL (stars), 10 μg/mL (circles), 25 μg/mL (triangles), 50 μg/mL (squares), and 100 μg/mL (rhombuses) at pH 7 in 20 mmol/L ammonium acetate buffer with the chamber pressure in ES at PSI 3.7 (2.55 × 10⁴ Pa).
FIG. 5 The ratios of dimer to the total number of dimer and monomers at pH 7 observed by ES-DMA as a function of Rituxan concentration at 5, 10, 25, 50, and 100 μg/mL (rhombuses). Ratios from droplet-induced dimers (line with filled squares) at the same concentrations calculated based on EquationEquation (6).
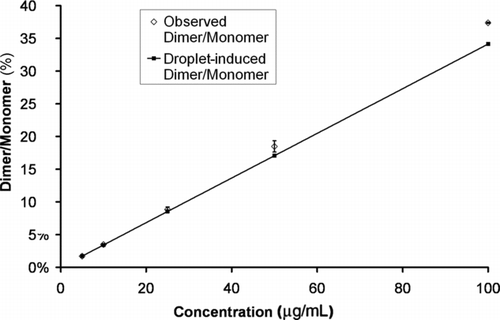
FIG. 6 ES droplet size distributions at pH 7 in 20 mmol/L ammonium acetate (Am Ac) buffer. The triangle, rhombus, and circle distributions are those of the same sample with the chamber pressure in ES at 2.3 PSI (1.59 × 10⁴ Pa), 3.0 PSI (2.07 × 10⁴ Pa), and 3.7 PSI (2.55 × 10⁴ Pa), respectively.
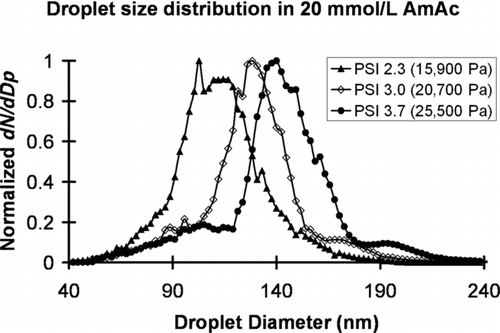
TABLE 1 The ratios of observed dimers to monomers from DMA measurement by varying the ES droplet volumes, and the ratios of dimers to monomers after correction for drop-induced dimers based on our model (the strategy in Section 4.2) for Rituxan at the concentration of 100 μg/mL at pH 7 in 20 mmol/L ammonium acetate buffer
TABLE 2 The ratios of observed dimers to monomers at pH 7 from DMA measurement, the ratios of intrinsic dimers to monomers calculated based on EquationEquations (27) and Equation(36), and the ratio of dimers to monomers measured by analytical ultracentrifuge for Rmab
FIG. 7 ES-DMA size distributions of 10 nm Au-NPs, Sample 1. The rhombus, square, and triangle data markers are those of 2×, 4×, and 8× dilutions of the original sample, respectively. Each of the discernable oligomer peaks is labeled respectively.
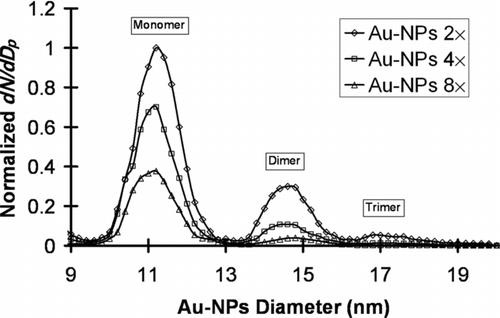
TABLE 3 The ratios of observed dimers to monomers from DMA measurement, and the ratios of intrinsic dimers to monomers calculated based on EquationEquation (38) for 10 nm Au-NPs
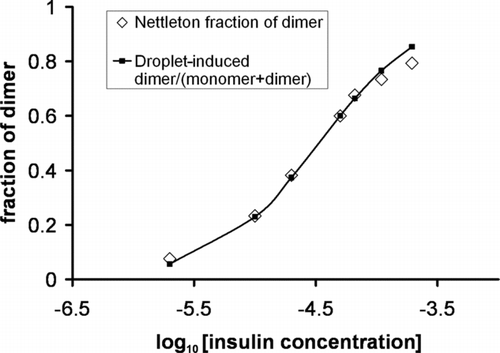
FIG. 8 The fraction of insulin dimer versus insulin total in the concentration range of 2–200 μmol/L at pH 3.3 and 22°C (rhombuses) as measured by CitationNettleton et al. (2000) using nano-ES/MS (line with open diamonds). The ratio of dimer/(monomer + dimer) calculated by EquationEquation (43) using the droplet-induced dimer for the concentration range of 2–200 μmol/L (line with filled squares).