Figures & data
FIG. 1 Experimental setup to study the influence of the water concentration of the carrier gas on the sintering process of SiO2 nanoparticles.
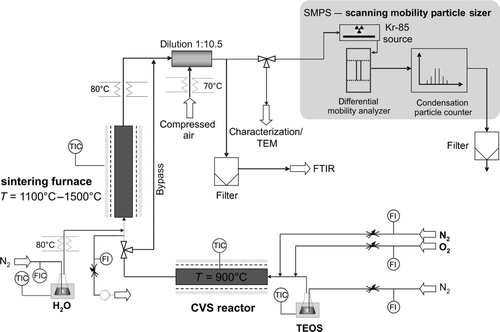
FIG. 2 Size distribution and TEM image of SiO2 nanoparticle aggregates synthesized at 900°C.
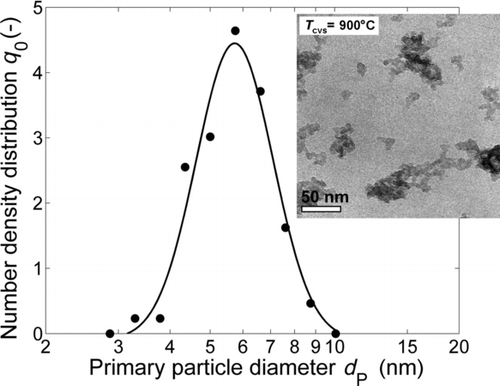
FIG. 3 FTIR absorbance spectra of the particle filtered gas streams entering the sintering furnace before mixing. The lower black line presents the spectra resulting from TEOS decomposition at 900°C. The middle and upper black lines represent the spectra of added nitrogen loaded with water at a bubbler temperature of 20°C and 60°C, respectively.
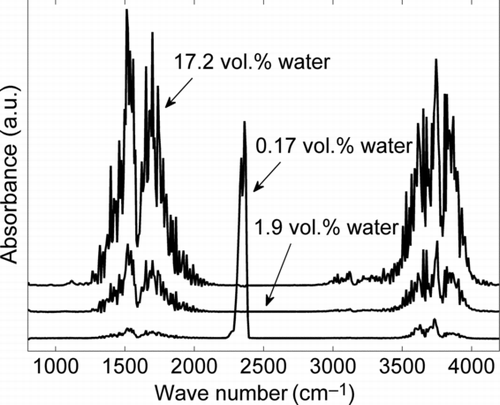
FIG. 4 Primary particle diameter d P, mobility diameter d M, and particle number concentration c N downstream of the sintering furnace as a function of sintering temperature. No additional water vapor was added.
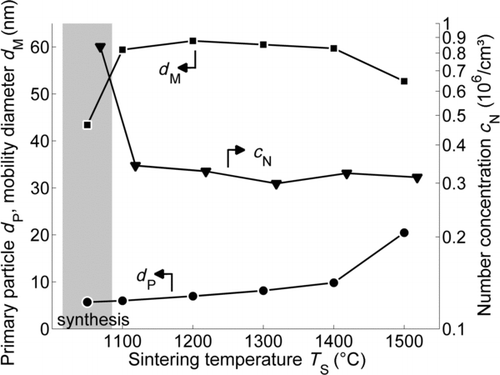
FIG. 5 TEM images of SiO2 nanoparticles downstream of the sintering furnace as a function of the sintering temperature T S and the water concentration of the carrier gas in the sintering furnace.
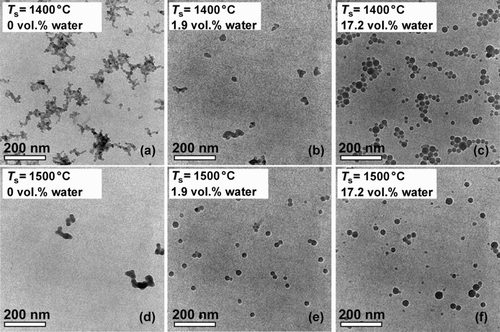
TABLE 1 Impact of the water concentration of the carrier gas on the aggregate structure when adding water vapor upstream of the sintering furnace
FIG. 6 Influence of the water concentration of the carrier gas on the primary particle size distributions measured downstream of the sintering furnace at T S = 1400°C, determined by TEM image analysis.
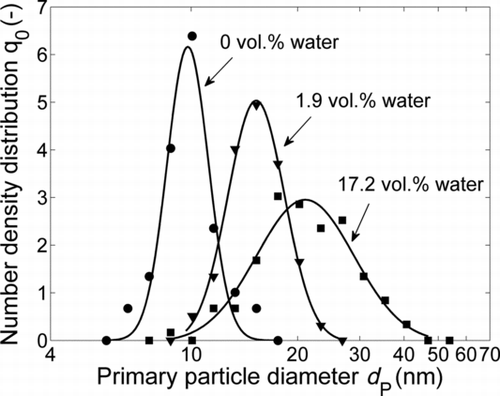
TABLE 2 Median and geometric standard deviation of primary particle size distributions (lognormal fit) of silica agglomerates, sintered at 1400°C with different water concentrations in the carrier gas
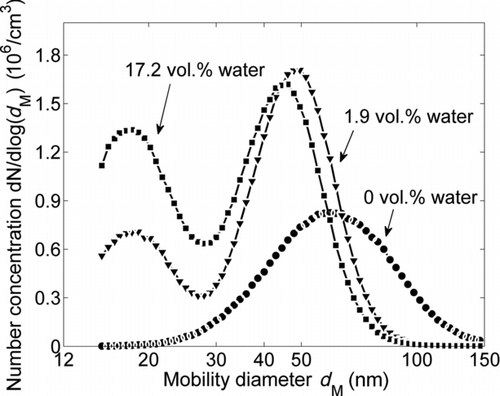
FIG. 7 Influence of the water concentration of the carrier gas on the SMPS mobility size distributions downstream of the sintering furnace at T S = 1400°C.
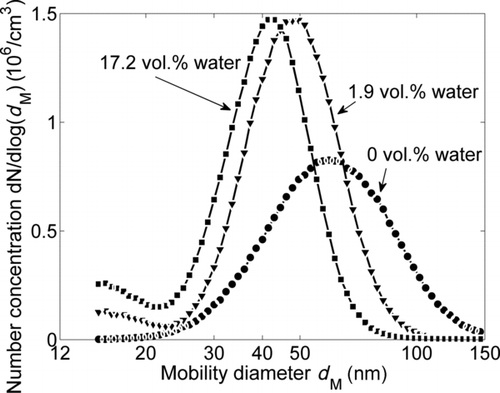
FIG. 8 Influence of the water concentration of the carrier gas on the primary particle size distributions downstream of the sintering furnace at T S = 1500°C, determined by TEM image analysis.
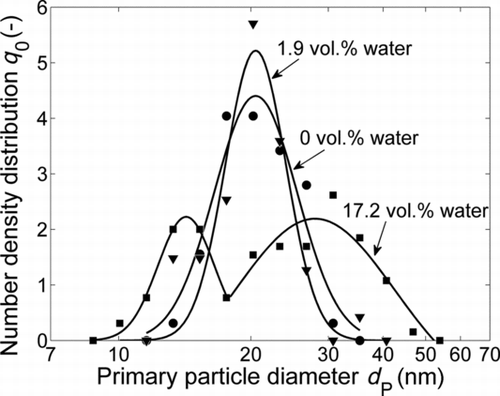
TABLE 3 Median and geometric standard deviation of primary particle size distributions (lognormal fit) of silica agglomerates, sintered at 1500°C with different water concentrations in the carrier gas
FIG. 9 Influence of the water concentration of the carrier gas on the SMPS mobility size distributions downstream of the sintering furnace at T S = 1500°C.