Figures & data
FIG. 1 The variation in the empty cavity ring down time with the starting position on the ring down trace of the 15-μs time gate, over which the experimental data are fitted. The average and standard deviation from fitting over a 1000 consecutive ring down events is shown. Inset: Natural logarithm of a typical empty cavity ring down trace, summed over three events. The linearity shows the single exponential nature of the ring down decay over ∼2.5 ring down times.
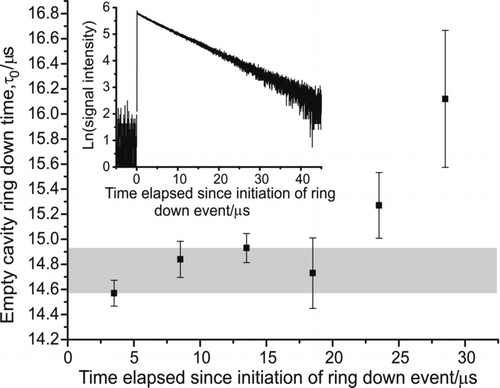
FIG. 2 (a) Uncertainty in the concentration measured by an aerosol electrometer (AE) as a function of particle number density. Data taken from of Fletcher et al. (Citation2009). The solid line is the 1:1 relationship, with the dashed lines marking the bounds of the uncertainty. (b) Particle number density measured by the Grimm CPC (black squares) relative to that recorded by the calibrated TSI 3775 for the 156-nm-diameter soot particles. The black line shows the 1:1 line based on the TSI count. The dashed line is a linear fit to the Grimm CPC data with a gradient of 0.897. (Color figure available online.)
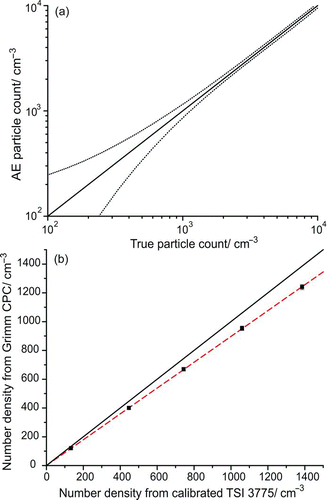
FIG. 3 Simulation showing the effect of a ±10% CPC counting error on the extinction efficiencies measured in an A-CRDS experiment. The squares are theoretical Q ext values calculated using Mie theory for 240-nm, 299-nm, 349-nm, 404-nm, 453-nm, 498-nm, 596-nm, and 707-nm-diameter particles for a refractive index of n = 1.5947 + 5 × 10⁻⁴ i at λ = 560 nm (Ma et al. Citation2003; Matheson and Saunderson Citation1952). The circles show the extinction efficiencies that would be measured by experiment if these values were subject to a CPC undercount of 10%, with the triangles showing the Q ext values expected if the CPC were overcounting by 10%. The lines show the variation in extinction efficiency with size parameter for the refractive indices retrieved from fits to each of the data sets: solid line (nr = 1.5947), dotted line (nr = 1.636), and dashed line (nr = 1.555). The imaginary part of the refractive index was fixed at 5 × 10⁻⁴ i. (Color figure available online.)
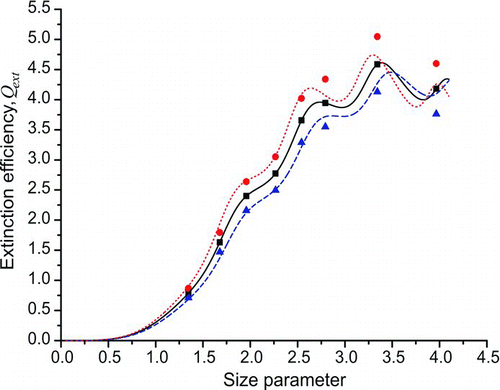
FIG. 4 The fractional change in the theoretical extinction efficiency relative to that at a refractive index of n = 1.59 + 5 × 10⁻⁴ i as the real part of the refractive index increases for particle diameters of 240 nm (filled squares), 299 nm (filled circles), 349 nm (filled triangles), 404 nm (filled inverted triangles), 453 nm (empty squares), 596 nm (empty circles), and 707 nm (empty triangles). The imaginary part of the refractive index was kept constant at 5 × 10⁻⁴ i and a wavelength of 560 nm was used to calculate the size parameter. (Color figure available online.)
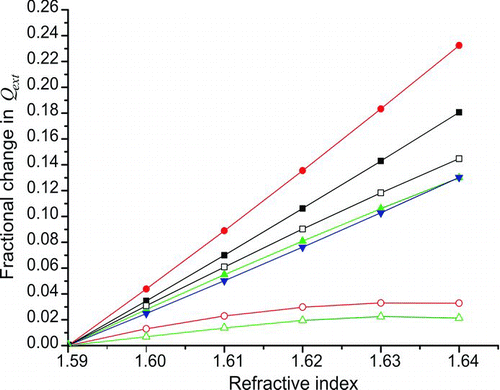
FIG. 5 Shift in the Q ext curve with increasing layer thickness calculated using MieLayer, assuming a surfactant shell of refractive index 1.45 on a polystyrene core of refractive index 1.5947. The inset shows an enlarged view of the Q ext curves at the larger core radii. The black dashed line depicts the result for an uncoated particle, with the remaining lines having shell thicknesses of 5 nm, 10 nm, and 15 nm, showing increasing shift from the homogeneous predictions in the inset. (Color figure available online.)
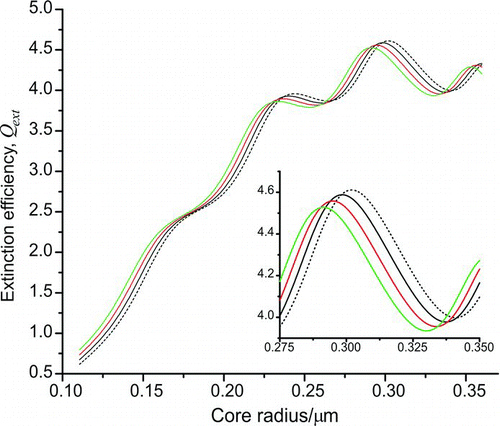
FIG. 6 The real part of the refractive index that would be retrieved from experimentally measured extinction efficiency values as a function of core diameter and layer thickness if polystyrene-surfactant core-shell particles were present in the ring down cavity but not accounted for in the data processing. The data points correspond to polystyrene core diameters of 240 nm (filled black squares), 299 nm (empty black squares), 349 nm (filled circles), 404 nm (empty circles), 453 nm (filled triangles), 498 nm (empty triangles), 596 nm (filled inverted triangles), and 707 nm (empty inverted triangles). A wavelength of 560 nm was assumed in all calculations and the imaginary part of the refractive index was kept constant at 5 × 10⁻⁴ i. (Color figure available online.)
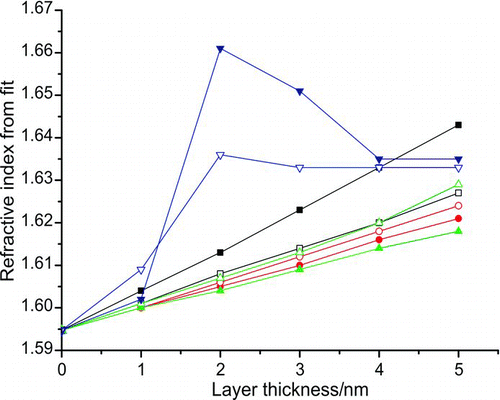
FIG. 7 The percentages of neutral, singly, doubly, and triply negatively charged particles as a function of particle diameter. Calculations were performed using equations and data contained in Wiedensohler (Citation1988). Triangles = neutral particles, circles = single negative charge, squares = double negative charge, inverted triangles = triple negative charge. (Color figure available online.)
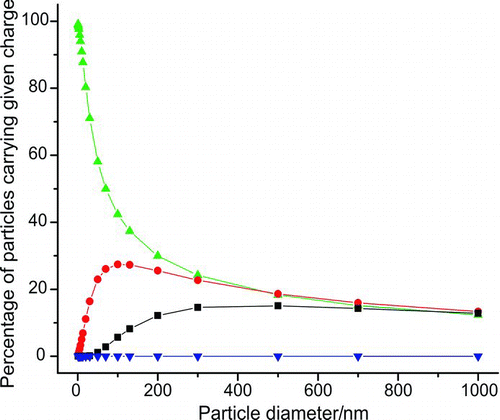
FIG. 8 Number density of crystalline NaCl aerosol generated from atomization of a 0.02 wt% aqueous solution, plotted as a function of DMA voltage. The diameter conversion of the three marked voltages is shown. (a) The size distribution measured by the second DMA when the primary DMA was set to a voltage of 107 V. The target peak is the most intense, with smaller peaks due to particles which passed in the original monomobile fraction with higher charges clearly seen. Panels (b) and (c) show the size distribution measured by the second DMA when the primary DMA was set at voltages of 200 V and 300 V, respectively. (Color figure available online.)
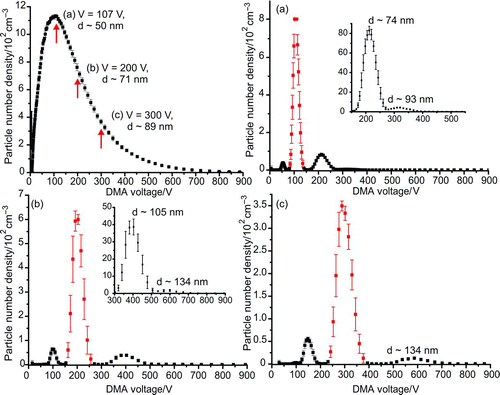
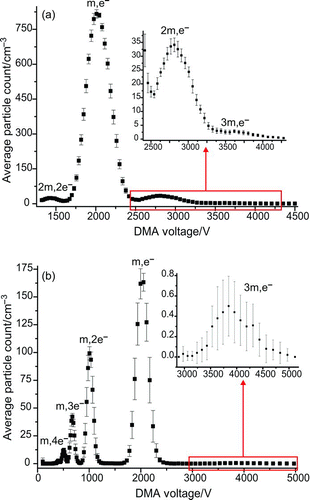
FIG. 9 (a) DMA voltage scan for the 299-nm-diameter beads, indentifying peaks due to singlet (m), doublet (2m), and triplet (3m) particles, with both single (e–) and double (2e–) charges. (b) The peaks seen in the voltage scan of the second DMA after reneutralization of the monomobile aerosol fraction passed by the primary DMA for the 299-nm-diameter beads. Strong peaks attributed to singlet particles with various charges were seen, as well as triplet particles with a single charge. (Color figure available online.)