Figures & data
TABLE 1 Properties of the volatility bins used in the theoretical experiments
FIG. 1 Simulated change in particle mass concentration of each component of a four-component hypothetical aerosol mixture in a TD (theoretical experiment 1). C 0 = 350 μg/m3, d 0 = 100 nm, T 0 = 25°C, and T TD = 60°C. C sat values are given at 25°C.
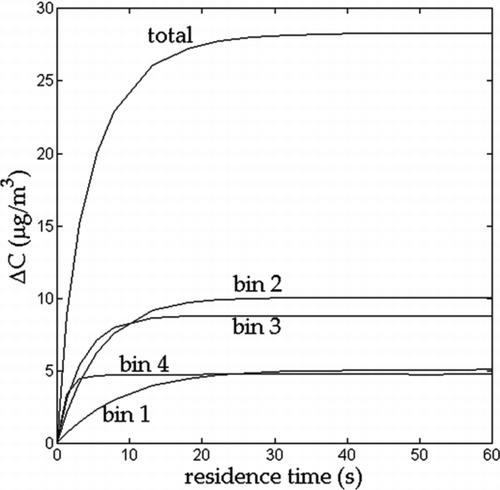
FIG. 2 Equilibration profiles of the simulated aerosol mixture obtained from change in total particle concentration using Equation (2) (diamonds), and from optimization of Equation (1) with the whole mixture represented by an effective single C sat (lines).
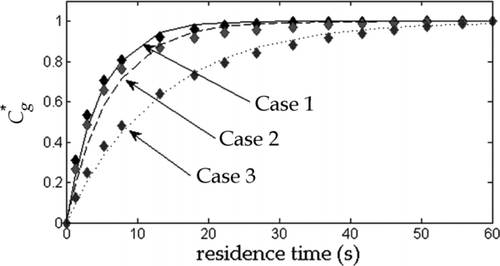
FIG. 3 Simulated change in absolute mole fractions (calculated as the sum of the absolute change for each volatility bin, ∑|Δxi |) versus mass fraction evaporated for a wide range of model aerosols. Properties used for these simulations are given in Table 1.
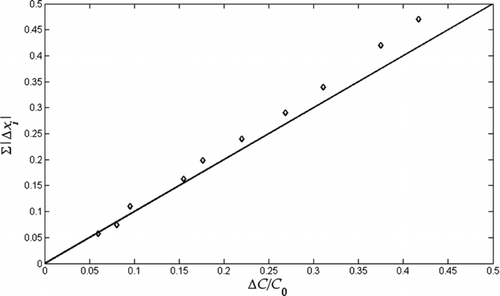
FIG. 4 Predicted error in measured α eff relative to theoretical α eff versus mass fraction evaporated for a range of model aerosols. Properties used for these simulations are given in Table 1.
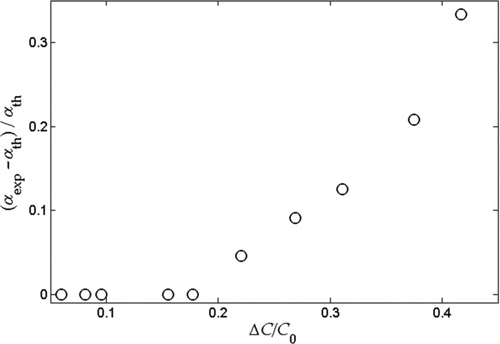
FIG. 5 Schematic of experimental setup. (Color figure available online.)
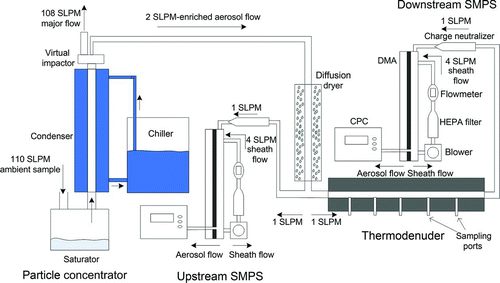
FIG. 6 Measured and simulated dimensionless vapor build-up profiles from Saleh et al. Citation(2011). T in = 25°C and T TD = 40°C. Mixture consists of succinic, adipic, pimelic, and azelaic acid in respective mole fractions of 0.1, 0.4, 0.4, and 0.1. Error bars correspond to 95% confidence intervals calculated using two-tailed Student's-t distribution; N = 10–15 for each data point.
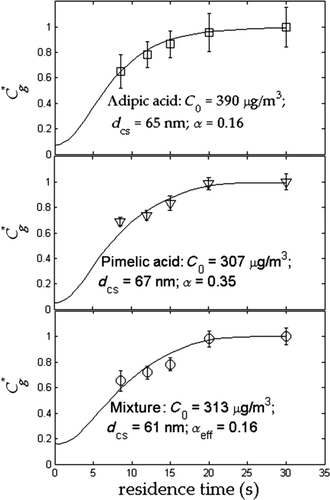
TABLE 2 Evaporation coefficients of lab-generated and ambient aerosols
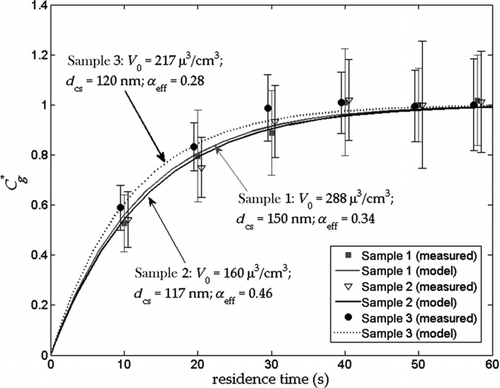
FIG. 7 Measured and simulated dimensionless equilibration profiles of concentrated ambient aerosol for three different days. T in = 25°C and T TD = 60°C. Samples 2 and 3 measured data are shifted in the plot by 0.5 s to the left and 0.5 s to the right, respectively, for clarity. Error bars correspond to 95% confidence intervals calculated using two-tailed Student's-t distribution; N = 10–15 for each data point.