1,665
Views
45
CrossRef citations to date
0
Altmetric
Regular Articles

Bioaerosol Sampling with a Wetted Wall Cyclone: Cell Culturability and DNA Integrity of Escherichia coli Bacteria

&
Pages 82-93 | Received 08 Feb 2010, Accepted 30 Jun 2011, Published online: 15 Aug 2011

Figures & data

FIG. 1 Test devices: (a) 800 L/min impactor. (b) 300 L/min Wetted Wall Cyclone (WWC).

FIG. 1 Test devices: (a) 800 L/min impactor. (b) 300 L/min Wetted Wall Cyclone (WWC).

FIG. 2 Setup for testing the WWC, impactor and filter sampler with bioaerosols. During testing with the E. coli particles, the WWC or the impactor or the filter was used to sample the bioaerosol.
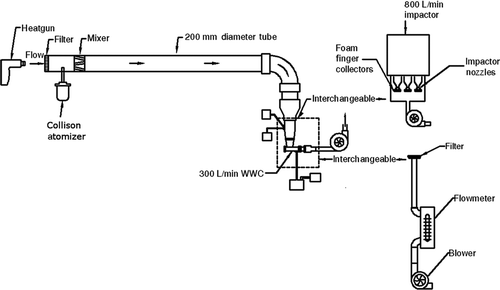
FIG. 2 Setup for testing the WWC, impactor and filter sampler with bioaerosols. During testing with the E. coli particles, the WWC or the impactor or the filter was used to sample the bioaerosol.

FIG. 3 PFGE gel image of E. coli genomic DNA collected by the impactor and the WWC from air at room temperature. Darkness of the wells at the top of each lane is an indication of the amount of relatively intact DNA. Impactor sampled air for different time periods. Lanes 1 and 2: Impactor 10 min collection during aerosolization period (for all the impactor samples, odd numbered lanes show the first wash and even numbered lanes the second wash). Lanes 3 and 4: Impactor, 10 min collection with 50 min additional operation. Lanes 5 and 6: Impactor, 10 min collection with 110 min additional operation. Lane 7: S. cerevisiae marker. Lanes 8 through 11: WWC collector hydrosol sample, 10 min collection during aerosolization period with 2 min additional operation for flushing. Lane 12: E. coli stock suspension.
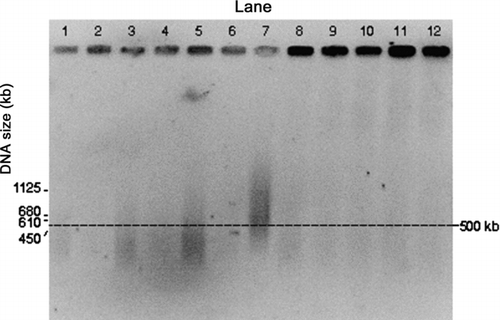
FIG. 3 PFGE gel image of E. coli genomic DNA collected by the impactor and the WWC from air at room temperature. Darkness of the wells at the top of each lane is an indication of the amount of relatively intact DNA. Impactor sampled air for different time periods. Lanes 1 and 2: Impactor 10 min collection during aerosolization period (for all the impactor samples, odd numbered lanes show the first wash and even numbered lanes the second wash). Lanes 3 and 4: Impactor, 10 min collection with 50 min additional operation. Lanes 5 and 6: Impactor, 10 min collection with 110 min additional operation. Lane 7: S. cerevisiae marker. Lanes 8 through 11: WWC collector hydrosol sample, 10 min collection during aerosolization period with 2 min additional operation for flushing. Lane 12: E. coli stock suspension.
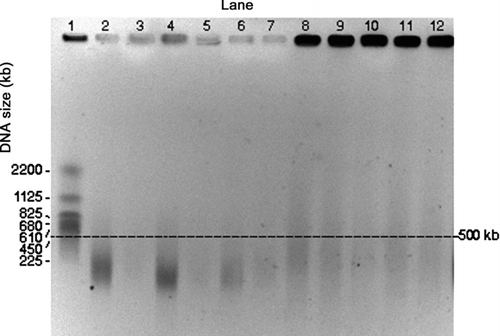
FIG. 4 PFGE gel images of E. coli genomic DNA collected by the impactor and the WWC collector from air at a temperature of 46°C. Darkness of the wells is an indication of the amount of relatively intact DNA in each lane. Lane 1: S. cerevisiae marker. Lanes 2 and 3: Impactor, 10 min collection during aerosolization period (for all the impactor samples, even numbered lanes are the first wash and odd numbered lanes the second wash). Lanes 4 and 5: Impactor, 10 min collection with 50 min additional operation. Lanes 6 and 7: Impactor, 10 min collection with 110 min additional operation. Lanes 8–11: WWC collector hydrosol sample, 10 min collection during aerosolization period with 2 min additional operation for flushing. Lane 12: E. coli stock suspension.

FIG. 4 PFGE gel images of E. coli genomic DNA collected by the impactor and the WWC collector from air at a temperature of 46°C. Darkness of the wells is an indication of the amount of relatively intact DNA in each lane. Lane 1: S. cerevisiae marker. Lanes 2 and 3: Impactor, 10 min collection during aerosolization period (for all the impactor samples, even numbered lanes are the first wash and odd numbered lanes the second wash). Lanes 4 and 5: Impactor, 10 min collection with 50 min additional operation. Lanes 6 and 7: Impactor, 10 min collection with 110 min additional operation. Lanes 8–11: WWC collector hydrosol sample, 10 min collection during aerosolization period with 2 min additional operation for flushing. Lane 12: E. coli stock suspension.

TABLE 1 Total CFU counts for samples collected with a 47 mm glass fiber filter, an impactor with an ethylene glycol-coated polyurethane foam collection surface, and a WWC. Each device ingested all of the aerosol output from the Collison atomizer. Tests were conducted with the sampled air at RT (24°C) and at an elevated temperature. The samples were collected during a 10 min aerosolization period, but the WWC was run for two additional min to allow bacteria to be flushed from the unit

FIG. 5 PFGE gel image of the separation of the E. coli genomic DNA collected at RT and digested with NotI. Samples are from the impactor (Lanes 2 and 4), the WWC (Lanes 5 and 7), and the E. coli stock suspension (Lane 8). Lambda ladder samples (Lane 1) are shown for comparison. The three impactor samples are replicates that were collected over 10 min periods and combined the first and second washes. The three WWC samples are replicates that were collected over 10 min sampling periods followed by 2 min rinses. (Courtesy of Emilia Mollova, US Genomics).
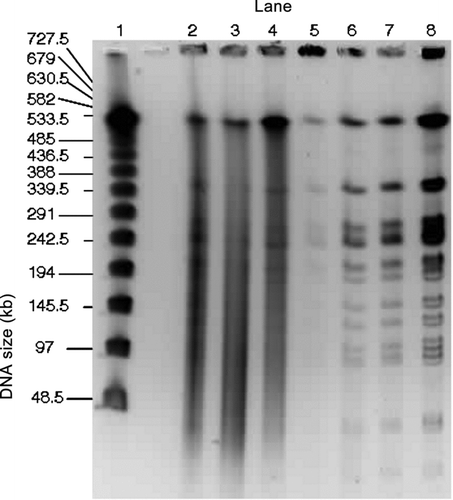
FIG. 5 PFGE gel image of the separation of the E. coli genomic DNA collected at RT and digested with NotI. Samples are from the impactor (Lanes 2 and 4), the WWC (Lanes 5 and 7), and the E. coli stock suspension (Lane 8). Lambda ladder samples (Lane 1) are shown for comparison. The three impactor samples are replicates that were collected over 10 min periods and combined the first and second washes. The three WWC samples are replicates that were collected over 10 min sampling periods followed by 2 min rinses. (Courtesy of Emilia Mollova, US Genomics).

FIG. 6 (a) Real-time PCR amplification of Impactor and WWC samples compared with a standard curve that was prepared from serial dilutions of the E. coli stock suspension. Samples for the impactor and WWC were applied in 1×, 2×, 10× and 100× dilutions of the initial sample volumes. (b) Gel images of traditional PCR amplification of the 1.375 kb recA fragment from the E. coli samples collected from air at room temperature with the impactor and the WWC. Lane 1: Impactor 10 min collection during aerosolization period. Lane 2: Impactor 10 min collection with 50 min additional operation. Lanes 3–4: WWC 10 min collection during aerosolization period with 2 min additional operation for flushing. Lane 5: E. coli stock suspension. Lane 6: Negative control (E. coli cells only). Lanes 7 and 8: 1 kb ladder (NEB). Lane 9: Negative control (reaction mixture lacking DNA).
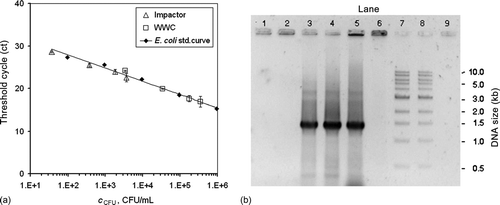
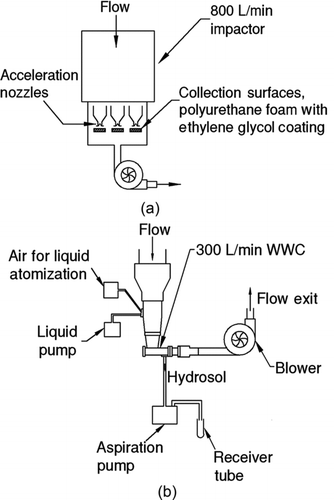
FIG. 6 (a) Real-time PCR amplification of Impactor and WWC samples compared with a standard curve that was prepared from serial dilutions of the E. coli stock suspension. Samples for the impactor and WWC were applied in 1×, 2×, 10× and 100× dilutions of the initial sample volumes. (b) Gel images of traditional PCR amplification of the 1.375 kb recA fragment from the E. coli samples collected from air at room temperature with the impactor and the WWC. Lane 1: Impactor 10 min collection during aerosolization period. Lane 2: Impactor 10 min collection with 50 min additional operation. Lanes 3–4: WWC 10 min collection during aerosolization period with 2 min additional operation for flushing. Lane 5: E. coli stock suspension. Lane 6: Negative control (E. coli cells only). Lanes 7 and 8: 1 kb ladder (NEB). Lane 9: Negative control (reaction mixture lacking DNA).

Reprints and Corporate Permissions

Please note: Selecting permissions does not provide access to the full text of the article, please see our help page How do I view content?

To request a reprint or corporate permissions for this article, please click on the relevant link below:

Academic Permissions

Please note: Selecting permissions does not provide access to the full text of the article, please see our help page How do I view content?

Obtain permissions instantly via Rightslink by clicking on the button below:

If you are unable to obtain permissions via Rightslink, please complete and submit this Permissions form. For more information, please visit our Permissions help page.