Figures & data
FIG. 1 (a) Components of the 2D-TAG system (originally described in Goldstein et al. Citation2008), including the thermal modulation system illustrating the use of a vortex cooler to provide forced air cooling for the single-stage pressure pulse modulator. Bold elements remain heated and dashed elements are thermally cycled during collection–desorption–analysis cycling. A heat exchanger inside the oven creates a differentially heated air stream that passively tracks the oven temperature. Components inside the shaded gray box are shown in more detail in (b).
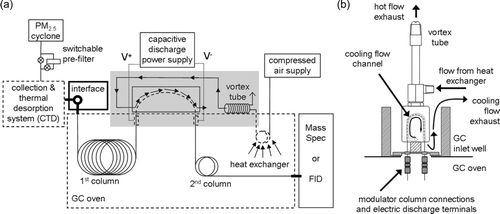
FIG. 2 Variation in the temperature of the cooling flow across the trapping capillary (vortex out), the temperature of the supply air from the heat exchanger (vortex in), the desorption temperature of the trapping capillary (modulator desorption) and the GC oven temperature during the course of a standard GC run for an air supply of 25 psi and with 75% of the flow exiting the cold side of the vortex tube.
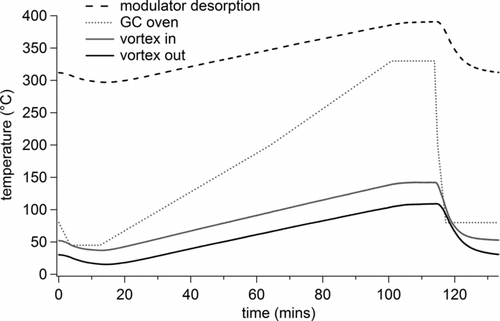
FIG. 3 A GC × GC chromatogram of a 76-component standard (center) along with 1D cross-sections of 10 selected compounds that span both the volatility and the polarity windows of the 2D-TAG instrument. This chromatogram shows the extracted ions of m/z 57, 60, 178, 180, 202, 218, 219, 228, 252, 276, 278, and 300. Peak widths in milliseconds at half maximum height (FWHM) are given for the major slices. Each cross-section is 15 s wide.
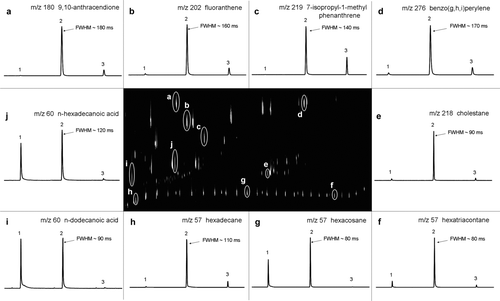
TABLE 1 Precision of the primary (t R 1) and secondary (t R 2) retention times, full peak width at half maximum height (FWHM) for 10 compounds spanning 2D-TAG's volatility and polarity windows. Mean and standard deviations based on four repeat injections, over a seven-day period, of a 76-component standard mixture of alkanes, polycyclic aromatic hydrocarbons, oxygenated polycyclic aromatic hydrocarbons, carboxylic acids, hopanes, steranes, and ketones. Per compound injection level given in nanograms (ng) on-column
TABLE 2 Detection and quantification limits and full peak width at half maximum height (FWHM) for 10 compounds spanning 2D-TAG's volatility and polarity windows. Matches to the NIST08 mass spectral library are shown as the forward match (FM) and reverse match (RM). Limits of quantification (LOQ) were determined from five-point calibration curves of a 110-component standard mixture of alkanes, polycyclic aromatic hydrocarbons, oxygenated polycyclic aromatic hydrocarbons, carboxylic acids, hopanes, steranes, and ketones. Calibration curves showed a power law dependence of the form (y = axb + c), similar to previous quantification work of the TAG system (Kreisberg et al. Citation2009)
FIG. 4 Peak widths in milliseconds at half maximum heights (FWHM) as a function of the primary (t R 1) and secondary (t R 2) retention times for the full range of C14–C40 n-alkanes and 3- to 7-ring polycyclic aromatic hydrocarbons (PAHs) and for a selection of C12–C18 n-alkanoic acids, hopanes, steranes, ketones, oxygenated PAHs (oxy-PAHs), and two multifunctional compounds. Each data point represents an individual compound and the differences in the marker sizes illustrate the FWHM, with larger marker sizes reflecting broader peaks.
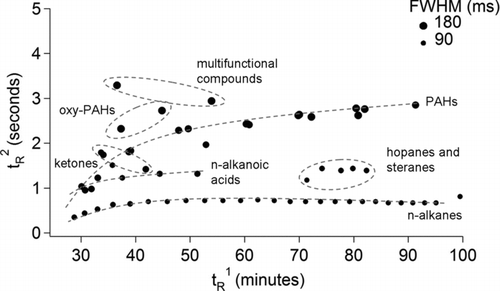
FIG. 5 (a) Calibration response curve of n-tetracosane in the external standard (ES) to perdeuterated n-tetracosane in the internal (IS) from multiple (17 in total) co-injections at seven different concentration levels. (b) Time series of detector response for n-tetracosane (C24H50) in ambient air (AMB) sampled in Berkeley, CA, and detector response to 10 ng of perdeuterated n-tetracosane (C24D50) injected with each ambient run as part of a 21-component internal standard mixture. (c) Ratio of n-tetracosane in ambient air (AMB) to perdeuterated n-tetracosane (IS) injected in each run. (d) Calibrated time series of n-tetracosane (ng m−3) in ambient air determined by applying the calibrated detector response shown in (a) to the observed ratio of ambient n-tetracosane to perdeuterated n-tetracosane.
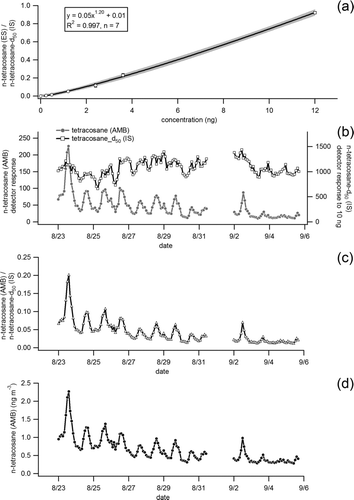
FIG. 6 Plot of normalized detector response for 10 ng of perdeuterated n-hexadecane (C16D34) injected on top of ambient air for a two-week period in Berkeley, CA, illustrating overall system stability. The solid line represents the average response over the measurement period and the dashed lines the standard deviation.
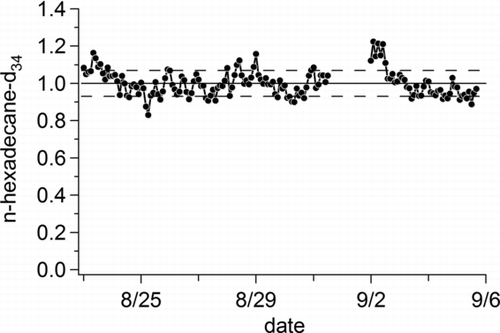
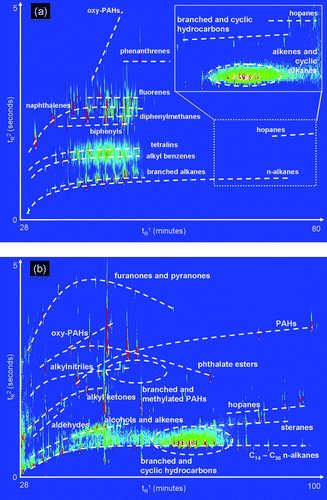
FIG. 7 (a) A GC × GC chromatogram of oxidized diesel exhaust acquired at the Carnegie-Mellon University smog chamber. The enlarged region (inset) shows heavier compounds thought to be primary organic aerosol. Prominent classes of observed compounds are labeled. (b) A GC × GC chromatogram of ambient air from Pasadena, CA, acquired during the California at the Nexus between Climate and Air Quality (CalNex) atmospheric experiment. Commonly observed classes of observed compounds are labeled.