759
Views
9
CrossRef citations to date
0
Altmetric
Regular Articles

Measuring Ambient Acidic Ultrafine Particles Using Iron Nanofilm Detectors: Method Development

, &
Pages 521-532 | Received 18 Jul 2011, Accepted 06 Nov 2011, Published online: 04 Jan 2012

Figures & data

FIG. 1 The schematic of acid-coated nanoparticles generation and collection system. Note: A is the ultrasonic nebulizer; B is the quartz tube furnace; C are two conical flasks with purified water for cooling gas and removing large-size particles preliminarily; D is the silicone gel dryer to absorb the water mist; E is the filter to remove the particles with a size larger than 1 μm; F is a pump (0.5 L/min flow rate) to draw the carbon nanoparticles to G; G is the conical flask with highly pure H2SO4 for the generation of sulfuric acid vapor on a heater; H is the water-cooled condenser; J is SMPS + ESP; and K is CPC.
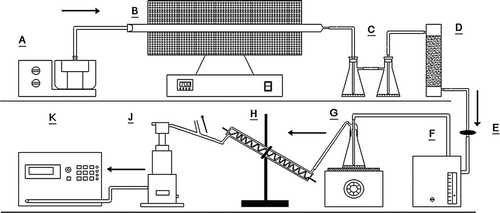
FIG. 1 The schematic of acid-coated nanoparticles generation and collection system. Note: A is the ultrasonic nebulizer; B is the quartz tube furnace; C are two conical flasks with purified water for cooling gas and removing large-size particles preliminarily; D is the silicone gel dryer to absorb the water mist; E is the filter to remove the particles with a size larger than 1 μm; F is a pump (0.5 L/min flow rate) to draw the carbon nanoparticles to G; G is the conical flask with highly pure H2SO4 for the generation of sulfuric acid vapor on a heater; H is the water-cooled condenser; J is SMPS + ESP; and K is CPC.

FIG. 2 Two-dimensional (2D) and three-dimensional (3D) images of a reaction spot caused by a 75.4 nm sulfuric acid droplet generated from the H2SO4 solution with a concentration of 0.009 g/cm3.

FIG. 2 Two-dimensional (2D) and three-dimensional (3D) images of a reaction spot caused by a 75.4 nm sulfuric acid droplet generated from the H2SO4 solution with a concentration of 0.009 g/cm3.

FIG. 3 Correlation between horizontal distance (width) of reaction spot scanned by AFM and the diameter of generated acidic droplets. The primary vertical axis represents the width of reaction spots; the secondary vertical axis represents the ratio of the width of reaction spots to the diameter of generated acidic droplets. The vertical error bars represent the deviation of the measurements.
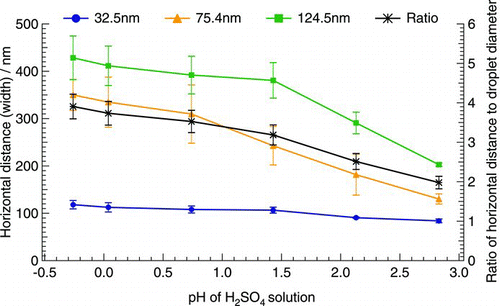
FIG. 3 Correlation between horizontal distance (width) of reaction spot scanned by AFM and the diameter of generated acidic droplets. The primary vertical axis represents the width of reaction spots; the secondary vertical axis represents the ratio of the width of reaction spots to the diameter of generated acidic droplets. The vertical error bars represent the deviation of the measurements.
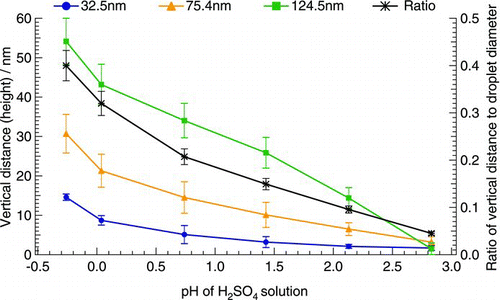
FIG. 4 Correlation between vertical distance (height) of reaction spot scanned by AFM and the diameter of generated acidic droplets. The primary vertical axis represents the height of reaction spots; the secondary vertical axis represents the ratio of the height of reaction spots to the diameter of generated acidic droplets. The vertical error bars represent the deviation of the measurements.

FIG. 4 Correlation between vertical distance (height) of reaction spot scanned by AFM and the diameter of generated acidic droplets. The primary vertical axis represents the height of reaction spots; the secondary vertical axis represents the ratio of the height of reaction spots to the diameter of generated acidic droplets. The vertical error bars represent the deviation of the measurements.

FIG. 5 Three-dimensional images of sulfuric acid-coated particle reaction spot on the 25-nm iron film; (a) A 32.5 nm acid-coated particle reaction spot; (b) A 51.5 nm sulfuric acid coated particle reaction spot. Note: The height of the reaction site above the iron-film surface was expressed as 0-2 vertical distance, and the width of the reaction site was taken as 2-2 horizontal distance i.e. maximum width of the reaction site. The central bump of the reaction site was taken as the width at half maximum value, shown as 1-1 horizontal distance.
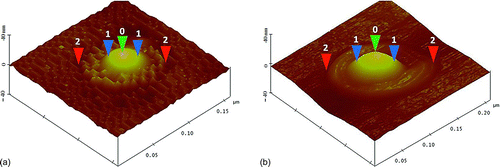
FIG. 5 Three-dimensional images of sulfuric acid-coated particle reaction spot on the 25-nm iron film; (a) A 32.5 nm acid-coated particle reaction spot; (b) A 51.5 nm sulfuric acid coated particle reaction spot. Note: The height of the reaction site above the iron-film surface was expressed as 0-2 vertical distance, and the width of the reaction site was taken as 2-2 horizontal distance i.e. maximum width of the reaction site. The central bump of the reaction site was taken as the width at half maximum value, shown as 1-1 horizontal distance.

FIG. 6 Correlation between the dimension (width and height) of the reaction spots of acid-coated particles scanned by the AFM and the mobility diameter (Dm) of the acid-coated particles. The vertical error bars represent the deviation of the replicate measurements.
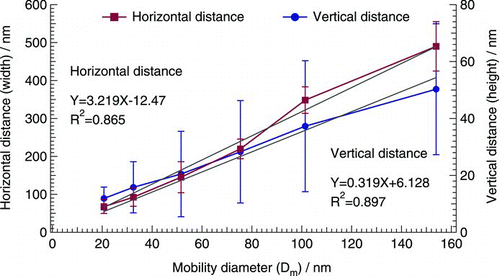
FIG. 6 Correlation between the dimension (width and height) of the reaction spots of acid-coated particles scanned by the AFM and the mobility diameter (Dm) of the acid-coated particles. The vertical error bars represent the deviation of the replicate measurements.

FIG. 7 AFM image of 32.5 nm acid-coated particles on Fe–Ti–MS detector; (a) AFM image before exposure to 90% RH and 20°C; (b) AFM image after 3-month exposure to 90% RH and 20°C.
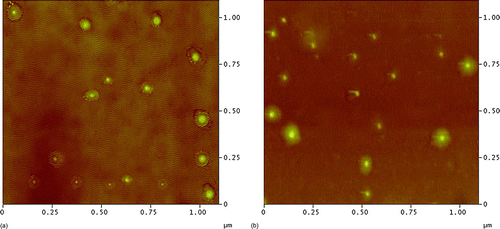
FIG. 7 AFM image of 32.5 nm acid-coated particles on Fe–Ti–MS detector; (a) AFM image before exposure to 90% RH and 20°C; (b) AFM image after 3-month exposure to 90% RH and 20°C.

TABLE 1 Acidic and nonacidic particles collected during the field measurement at TMS

FIG. 8 Ambient acidic particles collected on the iron nanofilm detectors at TMS:(a) an AFM image with a 2.9 μm × 2.9 μm scanning area on an Fe–MS nanofilm detector; (b) a 2.8 μm × 2.8 μm scanning area on an Fe–VE nanofilm detector.
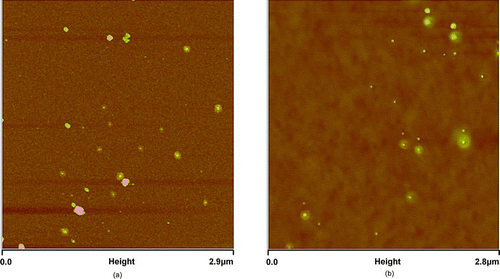
FIG. 8 Ambient acidic particles collected on the iron nanofilm detectors at TMS:(a) an AFM image with a 2.9 μm × 2.9 μm scanning area on an Fe–MS nanofilm detector; (b) a 2.8 μm × 2.8 μm scanning area on an Fe–VE nanofilm detector.

TABLE 2 Comparison of the number concentration of ambient particles calculated by AFM with the values derived from the SMPS + CPC in the field measurement

Supplemental material

uast_a_643258_sup_22933995.zip

Download Zip (14.1 MB)

Reprints and Corporate Permissions

Please note: Selecting permissions does not provide access to the full text of the article, please see our help page How do I view content?

To request a reprint or corporate permissions for this article, please click on the relevant link below:

Academic Permissions

Please note: Selecting permissions does not provide access to the full text of the article, please see our help page How do I view content?

Obtain permissions instantly via Rightslink by clicking on the button below:

If you are unable to obtain permissions via Rightslink, please complete and submit this Permissions form. For more information, please visit our Permissions help page.