Figures & data
FIG. 1 Schematic diagram of experimental setup.
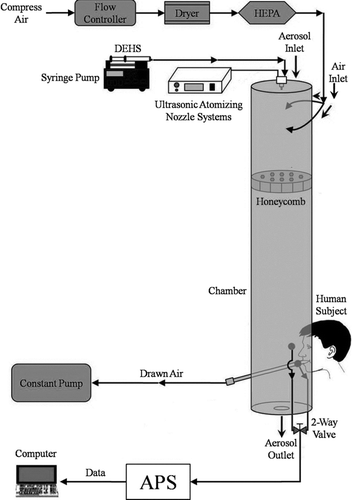
TABLE 1 Nose-related information of individual subject
FIG. 2 Particle size distribution before and after inhalation for the average deposition efficiency at minute volume of (a) 10 L, (b) 15 L, (c) 20 L, and (d) 30 L.
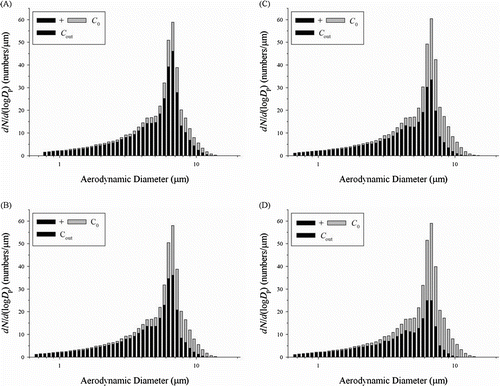
FIG. 3 Average nasal particle deposition as a function of inertial parameter (d 2 Q).
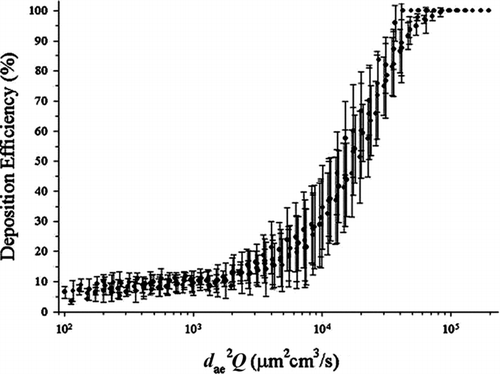
FIG. 4 Nasal particle deposition efficiency of subjects A, E, G, and I as a function of (a) inertial parameter (d 2 Q) and (b) Stokes number.
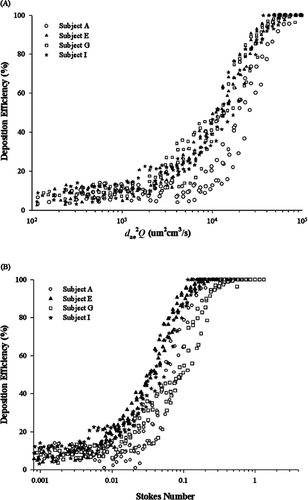
FIG. 5 Comparison of the deposition efficiency in the current study with other published studies.
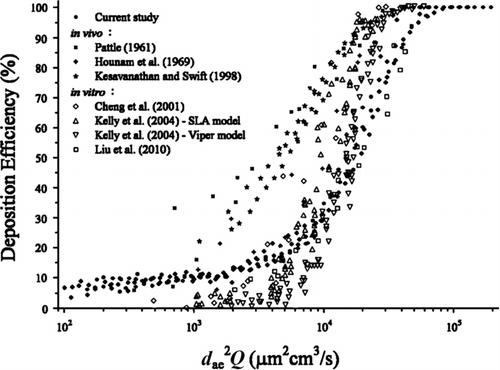
FIG. 6 Comparison of nasal particle deposition with and without the calibration of inhalation efficiency.
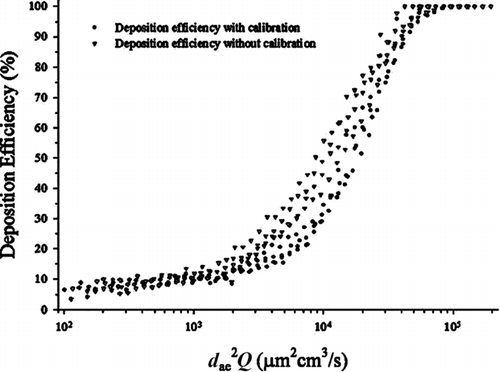
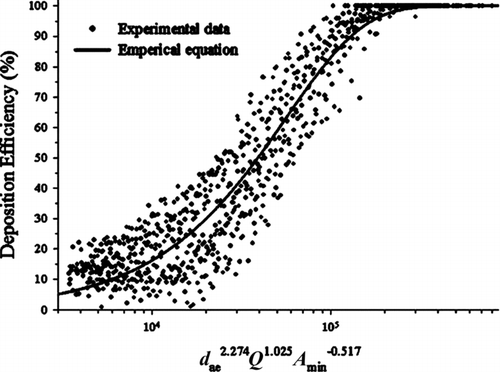
FIG. 7 Nasal particle deposition efficiency of Taiwanese adults as a function of d 2.274 ae Q 1.025 A −0.517 min .