Figures & data
FIG. 1 Multiple views of the EDB setup. (a) Expanded view of the EDB construction. (b) Electrical connectivity to the EDB. (c) Side view of the electrodes. (d) Top-down view of bottom pair of electrodes. (Color figure available online.)
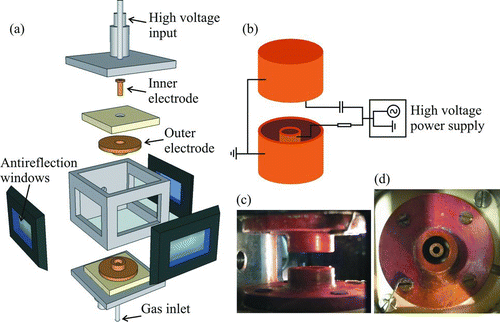
FIG. 2 Experimental configuration indicating the laser beam path and the detection angle for light scattering and imaging of a droplet in the trap. The droplet is launched from the droplet-on-demand generator in the horizontal plane midway between the upper and lower electrodes. (Color figure available online.)
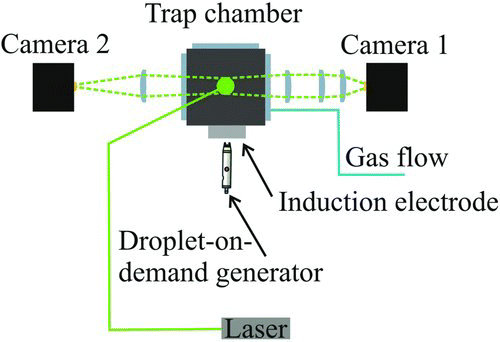
FIG. 3 An example of a phase function collected from a trapped droplet with an overlaid intensity plot. Vertical drop lines represent the angular values of the minima identified by the software and used to estimate the droplet size.
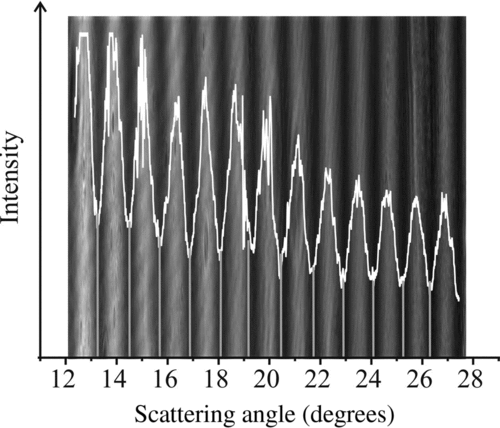
FIG. 4 Theoretical gas velocity (dashed line) along with experimentally derived velocity as a function of gas volume flow rate. Error bars indicate range of DC voltage over which droplet is stable.
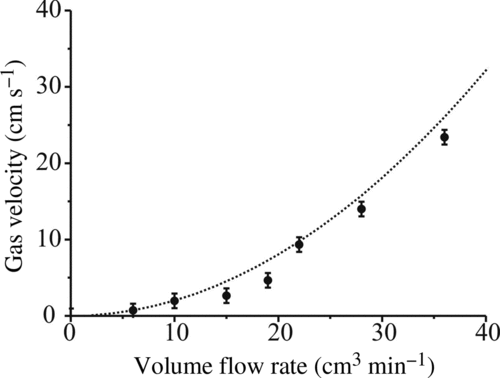
FIG. 5 Calibration of sizing technique using size standard particles. Dashed line represents the calculated size based on the peak-to-peak spacing using Equation (Equation1). The experimental points are measured peak-to-peak separations in the recorded diffraction patterns against the quoted size. The uncertainty in the angular separation is from the standard deviation in the measurement and the uncertainty in size is the standard deviation in particle size stated by the manufacturer (uncertainty in the absolute size is 0.5 μm in all cases).
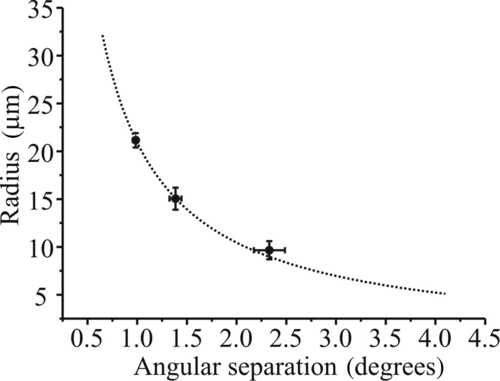
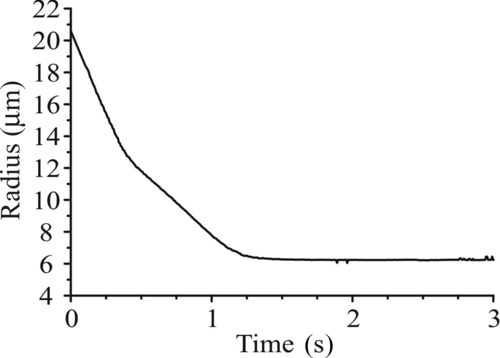
FIG. 6 (a) Comparison of the measured size evolution of an evaporating glycerol droplet (with a fixed refractive index) as determined by the geometrical optics approximation (gray) and from the fitting of phase functions to Mie theory (black). (b) Comparison of the size evolution with fixed refractive index in the geometrical optics approximation (black-dashed), postprocessed variable refractive index in the geometrical optics approximation (gray), and from a full Mie fitting (black) for a rapidly evaporating water–glycerol droplet.
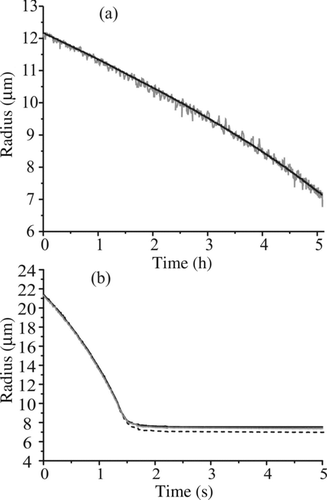
FIG. 7 (a) Typical data collection sequence for measuring the evaporation of water–glycerol droplets. (b) Expanded view of three droplets (solid black, gray, black dashed) overlaid with increasing line width for clarity, illustrating the reproducibility of the measurement.
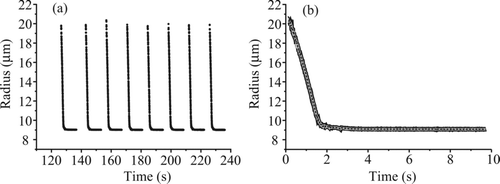
FIG. 8 Water evaporation from water–glycerol droplets of bulk solution concentration 17.4 g L–1 (gray) and 174 g L–1 without using a purge pulse sequence (dashed) and with (solid). The dotted line indicates the expected final size based on the expected initial concentration.
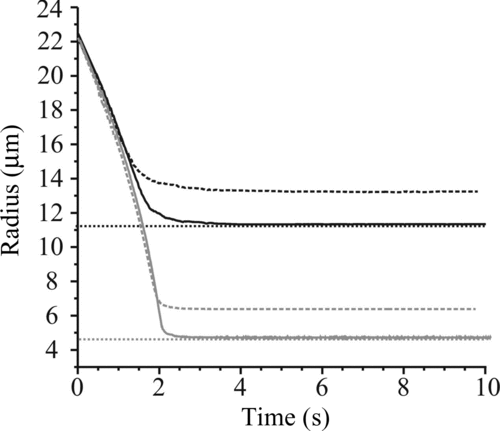
TABLE 1 Concentration and size values for each set of water–glycerol droplets studied. Expected final size based on initial concentration of glycerol and calculated initial concentration based on measured final size
FIG. 9 Comparison of the measured size of water–glycerol droplets of different starting concentrations (solid line) with predictions from simulations (dashed). The dark gray envelope indicates the uncertainty in the predicted time dependence arising from the uncertainty in the latent heat of evaporation of water from the mixture. (a) 17.4 g L−1 (inset: uncertainty envelope due to the largest uncertainty range in latent heat [dark gray] and gas jet velocity and temperature [light gray]), (b) 43.5 g L−1, (c) 87.0 g L−1, and (d) 174 g L−1. (Color figure available online.)
![FIG. 9 Comparison of the measured size of water–glycerol droplets of different starting concentrations (solid line) with predictions from simulations (dashed). The dark gray envelope indicates the uncertainty in the predicted time dependence arising from the uncertainty in the latent heat of evaporation of water from the mixture. (a) 17.4 g L−1 (inset: uncertainty envelope due to the largest uncertainty range in latent heat [dark gray] and gas jet velocity and temperature [light gray]), (b) 43.5 g L−1, (c) 87.0 g L−1, and (d) 174 g L−1. (Color figure available online.)](/cms/asset/2e8c1985-9806-4223-a8a4-bc346cf42d69/uast_a_652750_o_f0009g.jpg)
FIG. 10 The evolving concentration of glycerol in droplets of low (solid gray) and high (solid black) initial glycerol concentration along with results from the simulations (dashed). The horizontal dotted line (at 850 g L–1) indicates the concentration at which the deviation from the model begins in both cases shown, and in all measured cases.
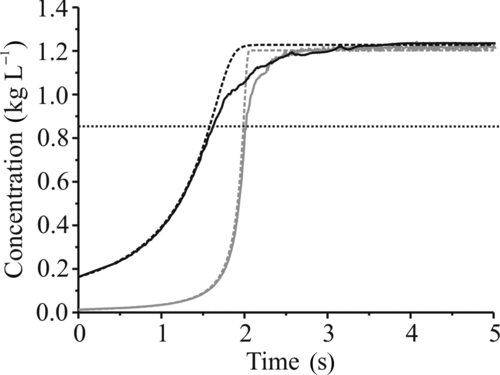
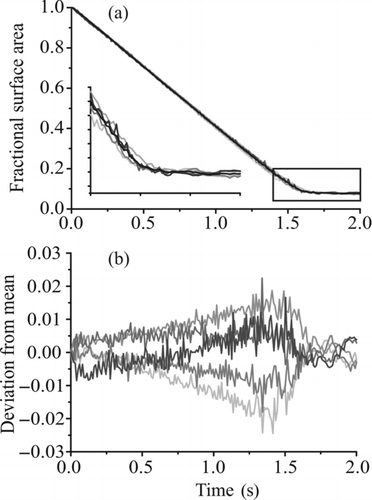
FIG. 11 Investigation of the effect of charge on the evaporation of water from water–glycerol droplets. (a) Fractional change in surface area for five induction voltages (400, 500, 600, 700, and 800 V, light gray to dark gray in increasing voltage) and the mean trend in size recorded from all the voltages (black). The inset shows an expanded view of the region indicated by the box. (b) Deviation in fractional surface area of each profile from the mean. A negative value indicates a fractional change less than the mean (i.e., faster evaporation).
