Figures & data
FIG. 1 The experimental setup.
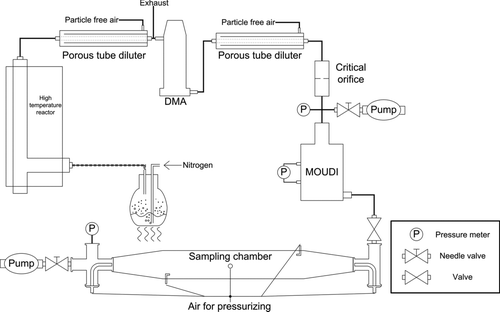
FIG. 2 Scheme of the sampling chamber.
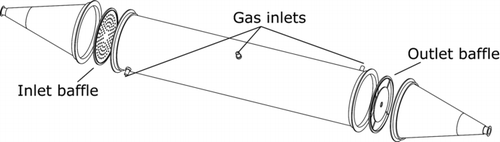
FIG. 3 The radial (vertical) velocities in the chamber without baffles (above) and with baffles (below). The flow rate through the chamber was 10 Lpm on the left-side cases and 60 Lpm on the right-side cases. The unit for the velocity was meters per second. (Color figure available online.)
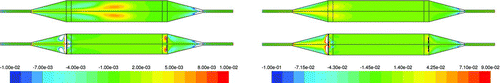
FIG. 4 The simulated gas streamlines in the chamber with a sample flow through the chamber (from left to right) without baffles (above) and with baffles (below). The sample flow was 10 Lpm on the left-side cases and 60 Lpm on the right-side cases. (Color figure available online.)
FIG. 15 The results of the saturation rate experiments. The concentration measured with a CPC at the outlet of the chamber while an aerosol sample flows through the chamber at two different flow rates. The x-axis indicates the volume of the aerosol introduced into the chamber. The concentration is normalized to the concentration of the aerosol at the inlet. (Color figure available online.)
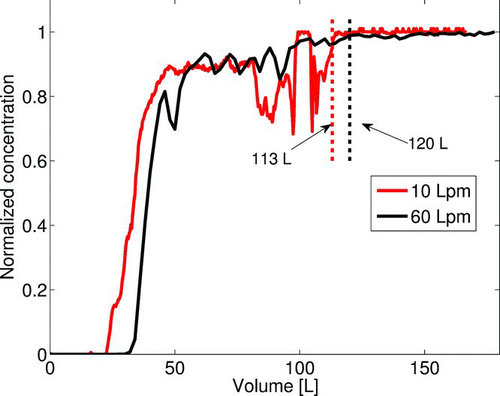
FIG. 6 (a) The normalized particle concentrations while taking a sample from the saturated sampling chamber at flow rate 0.3 Lpm. The data fit y = 0.998 exp(–7.78E–5 t), where t is in seconds, for 0.3-Lpm flow rate data is also shown. (b) The normalized particle concentration while the sample flow rates were 0.3 and 10 Lpm. The x-axis presents the sampled volume. (Color figure available online.)
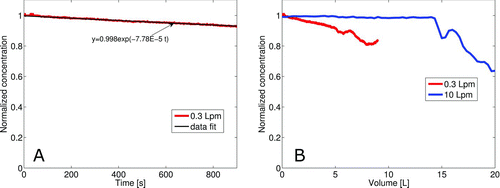
FIG. 7 The number size distributions of the aerosol sample fed to the chamber, and after the depressurization to (a) 500-mbar and (b) 200-mbar absolute pressure, and re-pressurization to atmospheric pressure. Also shown are the number size distributions at 500 and 200 mbar, corrected with the dilution factors (DF), 2 and 5, respectively. (Color figure available online.)
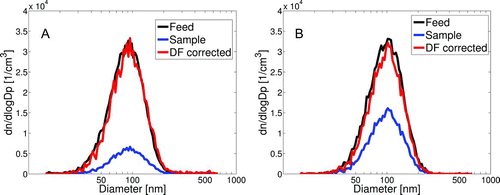
FIG. 8 The number size distribution of the aerosol sample fed into the sampling chamber and the distributions after 2, 13, and 28 min after pressurization. (Color figure available online.)
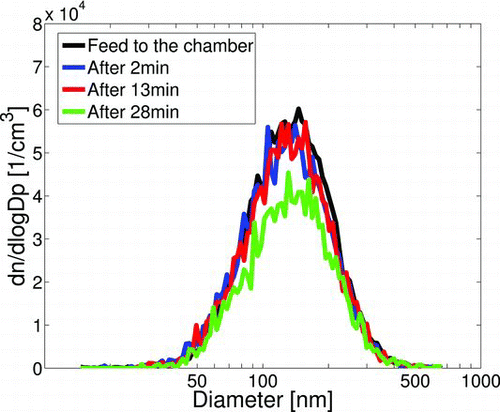
TABLE 1 The concentrations, geometric mean diameters (GMD), and geometric standard deviations (GSD) for the aerosol sample fed into the sampling chamber and collected from the chamber at 2, 13, and 28 min after pressurization
FIG. 9 The number size distributions of the intact and bounced TiO2 particles. (Color figure available online.)
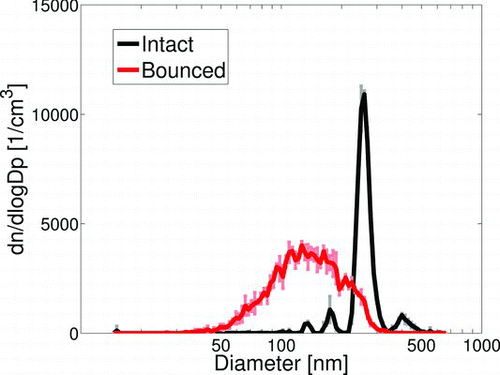
FIG. 10 TEM micrographs of the (a) intact, (b) impacted and deposited, and (c) impacted and bounced particles.
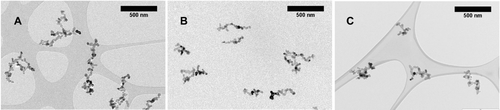
FIG. 11 The area-equivalent number size distributions of the intact, deposited, and bounced TiO2 agglomerates determined from TEM micrographs by image analysis. (Color figure available online.)
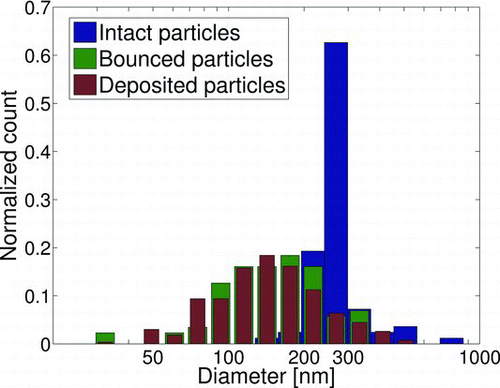
TABLE 2 The geometric mean diameters (GMD) and geometric standard deviations (GSD) of the intact, deposited, and bounced particles determined from TEM micrographs and measured with SMPS
TABLE 3 The fractal dimensions of the intact, deposited, and bounced particles measured with APM and SMPS, and calculated from the TEM micrographs
FIG. 12 The number of primary particles in an agglomerate as a function of agglomerate length per primary particle diameter in cases of (a) intact, (b) deposited, and (c) bounced particles. The dashed line represents the fitted data for the length-based fractal dimension. Values ka = 1.17 and α = 1.07 were used in EquationEquation (4) to calculate the number of primary particles.
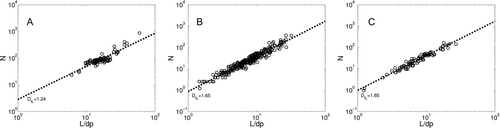
FIG. 13 The mass of the intact particles measured with APM as a function of particle diameter measured with SMPS. The dashed line represents the fitted data for mass-based fractal dimension.
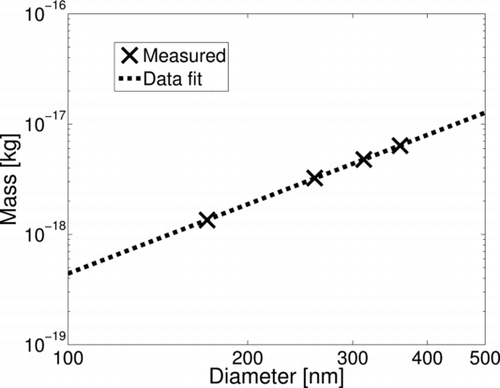
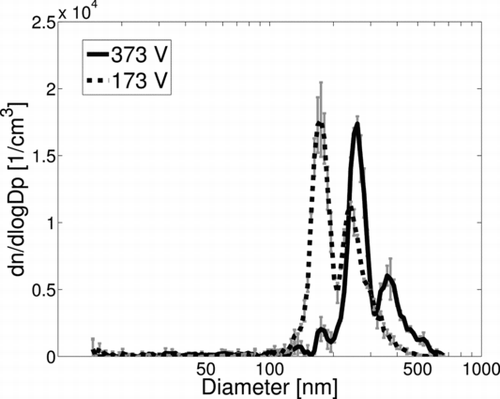
FIG. 14 The electrical mobility size distributions measured with SMPS after APM mass classification. Two cases are shown here, with different APM voltage settings, while the revolution rate was held constant.