Figures & data
FIG. 1 Schematic of the procedures used for (a) Smoluchowski radius and (b) projected area calculation for a colliding pair of particles. (Color figure available online.)
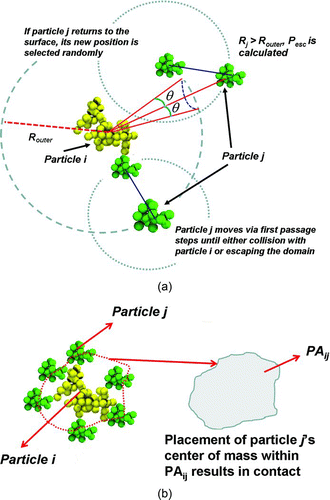
FIG. 2 Schematic of the mean first passage time calculation procedure. (Color figure available online.)
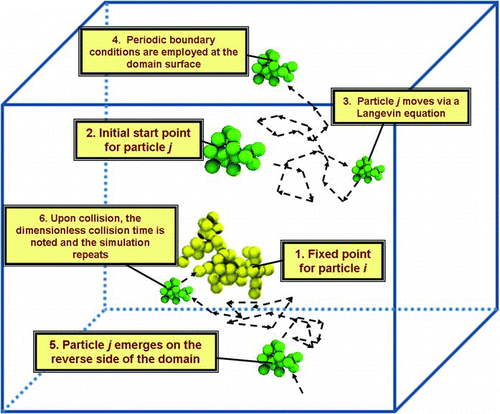
TABLE 1 Summary of the properties of the ten test aggregate pairs used in mean first passage time simulations. Reported RS,i , RS,j , PAi , PAj , RS,ij , and PAij are for aggregates with primary particle radii of 1 (arbitrary units)
FIG. 3 (a). Summary of the H(KnD ) results obtained with mean first passage time simulations for ten test aggregate pairs. For comparison, H(KnD ) curves corresponding to the continuum limit (12a), free molecular limit (12b), and regression equation from (Gopalakrishnan and Hogan [2011], EquationEquation (13)) are shown. (b) The relative difference between H(KnD ) inferred from mean first passage time calculations and EquationEquation (13) as a function of KnD . Relative difference is defined in the text. (Color figure available online.)
![FIG. 3 (a). Summary of the H(KnD ) results obtained with mean first passage time simulations for ten test aggregate pairs. For comparison, H(KnD ) curves corresponding to the continuum limit (12a), free molecular limit (12b), and regression equation from (Gopalakrishnan and Hogan [2011], EquationEquation (13)) are shown. (b) The relative difference between H(KnD ) inferred from mean first passage time calculations and EquationEquation (13) as a function of KnD . Relative difference is defined in the text. (Color figure available online.)](/cms/asset/5ded32e7-8e47-4205-a470-7dea99addf07/uast_a_701353_o_f0003g.jpg)
FIG. 4 Depiction of the phase space noting when gas to particle momentum transfer and particle–particle mass transfer (collisions) lie within the continuum, transition, and free molecular regimes. (Color figure available online.)
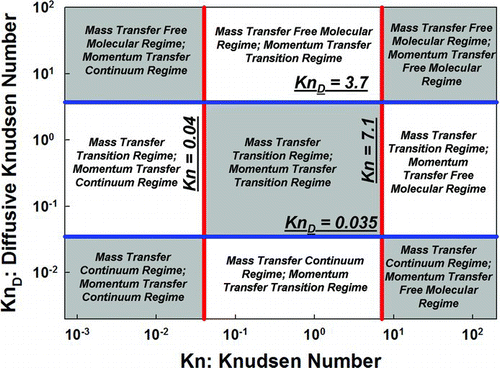
TABLE 2 Summary of the properties of the four test aggregate pairs used for comparison to previously developed aggregate collision kernel models. Reported length scales are for aggregates with primary particle radii of 1 (arbitrary units)
FIG. 5 Comparison of the relative difference between H predicted by (a) Cho et al. (Citation2011) and (b) Rogak and Flagan (Citation1992) and H predicted by EquationEquation (13), as a function of KnD , for four test aggregate pairs with properties noted in . (Color figure available online.)
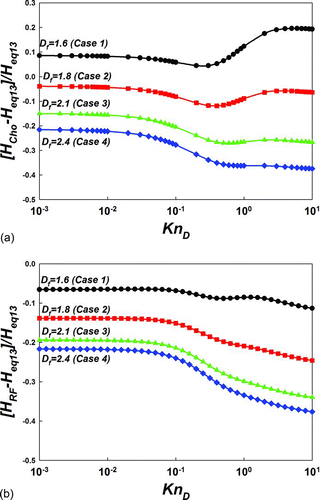
FIG. 6 (a) A comparison of PAij to RS,ij for test aggregate pairs. The black line denotes the curve PAij = πR2 S,ij . (b) A comparison between calculated RS,ij and a regression EquationEquation (21) developed to predict RS,ij from RS,i , and RS,j . (Color figure available online.)
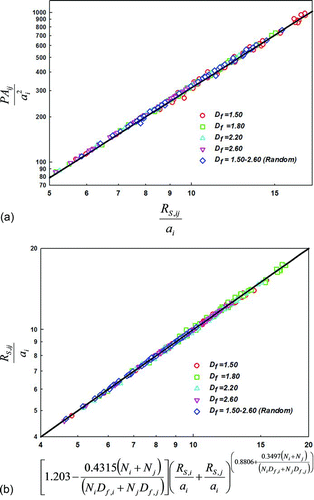
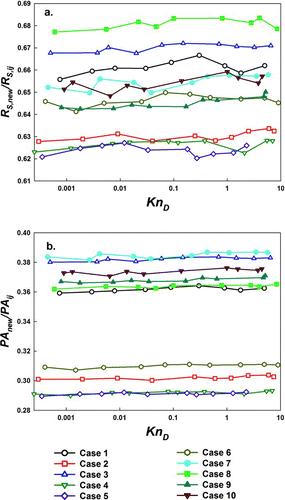
FIG. 7 (a) The average Smoluchowski radii and (b) and orientationally averaged projected area of aggregates formed from the collision of test aggregate pairs, as functions of KnD . (Color figure available online.)