Figures & data
FIG. 1 Schematic diagram of the optical layout of the depolarization measurement system for determining particle velocity showing the three main components: laser module, interrogation chamber, and detection module. A cartoon of the output pulses of the two PMT's is also shown for a typical particle going through the two laser beams (modified from Sivaprakasam et al. Citation2009). (Color figure available online.)
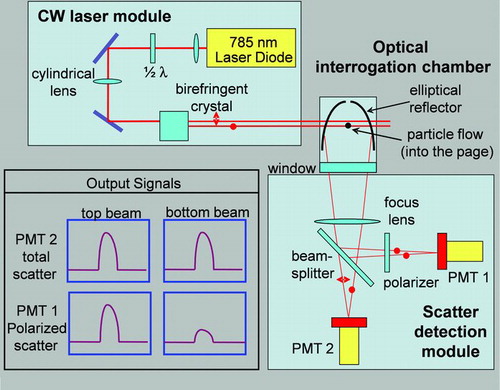
FIG. 2 Scatter plot of the polarized elastic scatter (PMT 1), total elastic scatter signal (PMT 2), and the ratio of the polarized to total scatter measured from mono-dispersed 1.5 μm spherical silica calibration particles, varying size PSL calibration particles, nonspherical bacterial spores and poly-dispersed ambient aerosol particles. (Color figure available online.)
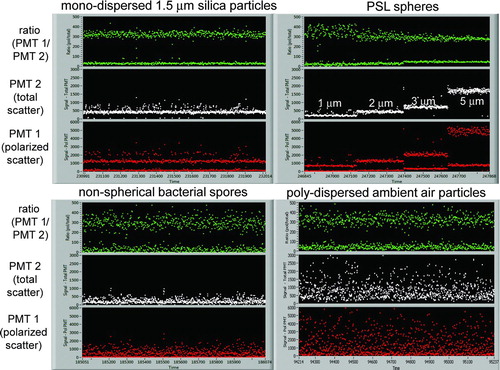
FIG. 3 Statistics of being able to assign velocity to individual particles utilizing polarization and traditional techniques highlights the advantage of the proposed technique. Data analysis was conducted on mono-dispersed 1.5 μm silica particles disseminated at varying throughput particle rates. (Color figure available online.)
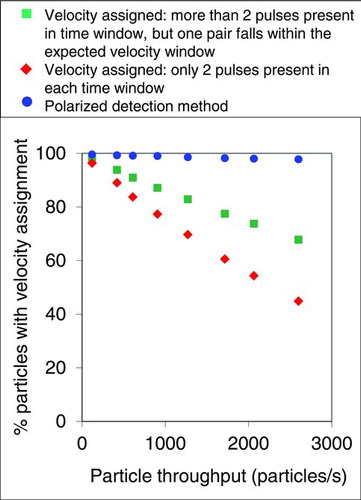
FIG. 4 Statistics of being able to assign velocity to individual particles utilizing polarization and traditional techniques as the window size is varied from ±0.5% to ±30% of the mode of the velocity distribution for particles flowing at a throughput rate of 900 particles/s. (Color figure available online.)
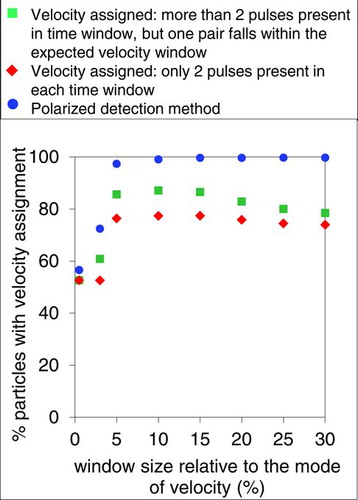
FIG. 5 Histogram and cumulative distribution of the ratio of the polarized to total elastic scatter measured for 1.5 μm silica particles flowing at two different throughputs rates of 120 and 2060 particles/s. The values of the distributions lower than 135 represents particles transiting the top beam and values of the distributions greater 240 represents particles transiting the bottom beam. At higher throughput rate particle coincidence type B leads to the distribution observed in the middle from 135 to 240. (Color figure available online.)
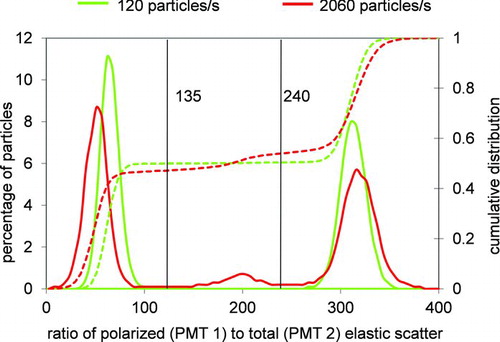
TABLE 1 Theoretical and experimental values measured for different types of coincidence events as a function of particle throughput rate for mono-dispersed silica spheres. Both experimental and model predictive values (parentheses) are shown
FIG. 6 Histogram and cumulative distribution of the total elastic scatter and polarized elastic scattered measured for 1.5 μm silica particles at a throughput rate of 2060 particles/s. Such distributions from mono-dispersed particles allows as estimation of coincidence of type A. (Color figure available online.)
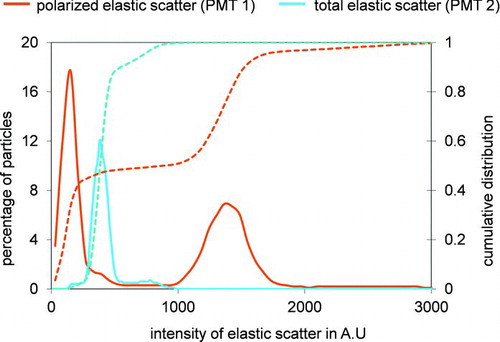
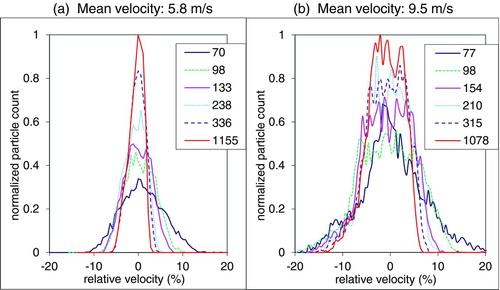
FIG. 7 Relative velocity distribution measured as a function of beam spacing for particles flowing at two mean velocities of 5.8 and 9.5 m/s. The velocity distribution converges as the beam spacing is increased. (Color figure available online.)