Figures & data
FIG. 1 Schematic of experimental system to measure charging efficiency and work function. (Reprinted from Zhou and Zachariah 2011 with permission from Elsevier.)
FIG. 2 Particle size distributions of neutral aggregates and sintered spherical silver nanoparticles. (Color figure available online.)
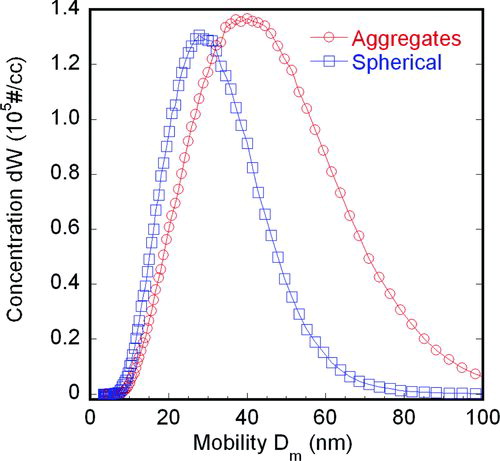
FIG. 3 TEM images of (a) aggregate silver particles (no DMA size selection) and (b) sintered (spherical) silver particles, particle size is 28.5 nm based on DMA selection and 28.6 nm based on TEM measurement. TEM measurement is based on total of 139 particles. (Reprinted from Zhou and Zachariah 2011 with permission from Elsevier.)
TABLE 1 Mobility size dependence of quantum yield
FIG. 4 Size-resolved normalized charging efficiency for (a) spherical silver particles and (b) aggregate silver particles. Dotted lines are power law fits. (Color figure available online.)
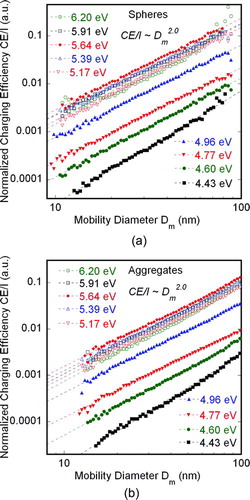
FIG. 5 Calculated photon absorption cross sections for spheres and aggregates as a function of particle mobility size. (Color figure available online.)
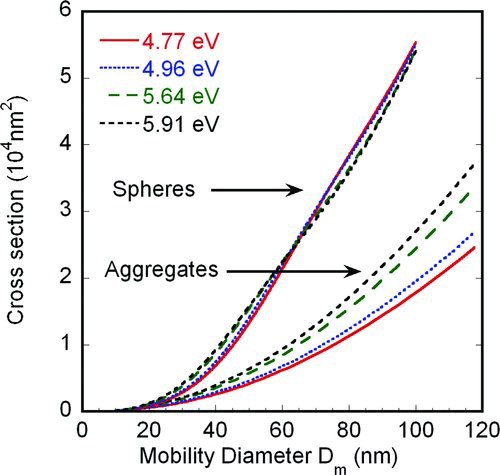
FIG. 6 Measured quantum yield for spherical particles. Data normalized with respect to a 15 nm sphere. The particle size dependence of quantum yield was obtained by curve fitting the data in the small size range (free molecular regime). (Color figure available online.)
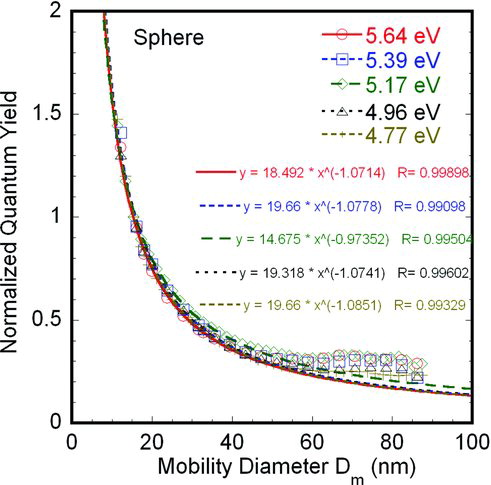
FIG. 7 χ as function of particle mobility size. Here, χ is the ratio of experimentally measured aggregates CE with the “ideal charging efficiency” defined in Equation (12) which is also the quantum yield Y(hv) normalized to a 15 nm sphere. (Color figure available online.)
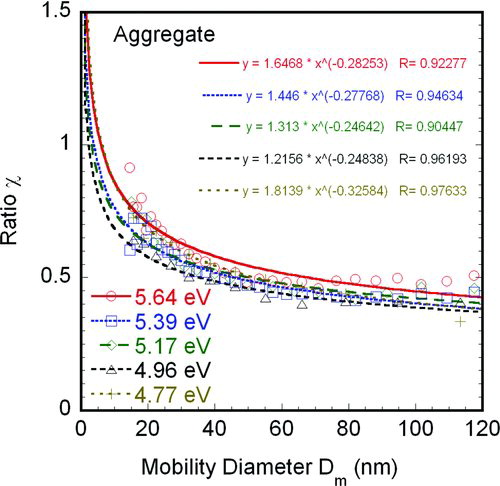
FIG. 8 Normalized charging efficiency vs. 1/Z for (a) spheres and (b) aggregates. Dashed line is linear fit using data points in full size range10–100 nm, dotted line only uses data points in size range ≤40 nm. (Color figure available online.)
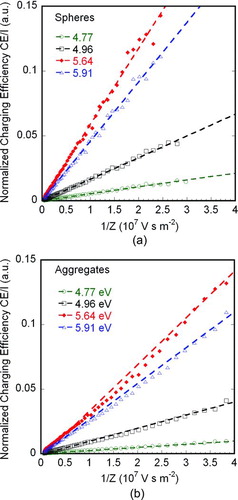
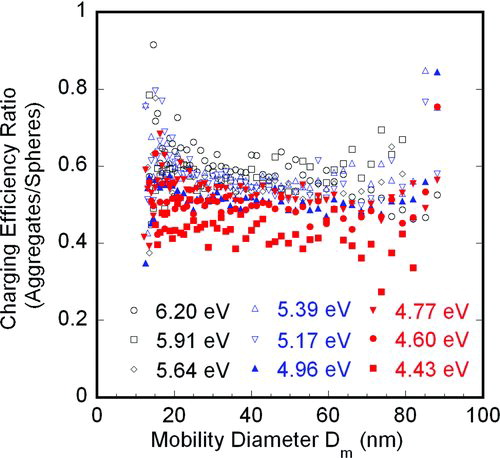
FIG. 9 Charging efficiency ratio for aggregates over spheres as a function of mobility size. (Color figure available online.)