Figures & data
FIG. 1 (a) TEM image of the gold nanorod sample. (b) Gold lattice spacing are used for the calibrations of the length and width of gold rods. (c) Histogram of rod length of the gold nanorod sample.
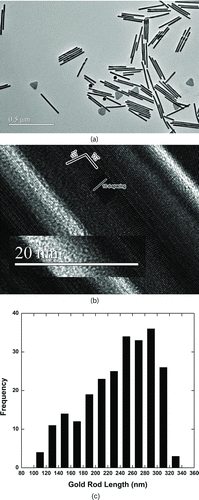
FIG. 2 (a) Histogram of the rod length of the gold nanorod sample after electrospray (ES) mobility size selection at a peak voltage 5530 volts, which corresponds to mobility size ∼67 nm at a sheath flow rate ∼1.333 × 10⁻⁴ m3/s (8 L/min), and aerosol flow rate ∼0.117 × 10⁻⁴ m3/s (0.7 L/min) using a nano-DMA. (b) Histogram of the rod width of the size selected gold nanorod sample.
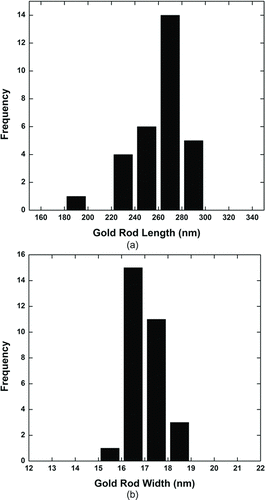
FIG. 3 Two mobility size distributions for the same monodisperse gold nanorods, measured at 0.5 × 10⁻⁴ m3/s (3 L/min), and 1.667 × 10⁻⁴ m3/s (10 L/min) sheath flow rates in a step mode nano DMA. The mobility diameter decreases from 73.7 to 65.3 nm with increasing sheath flow rate, which corresponds to an increase in the magnitude of the electric field. This figure clearly shows the alignment effect of electric field on mobility of rods. (Color figure available online.)
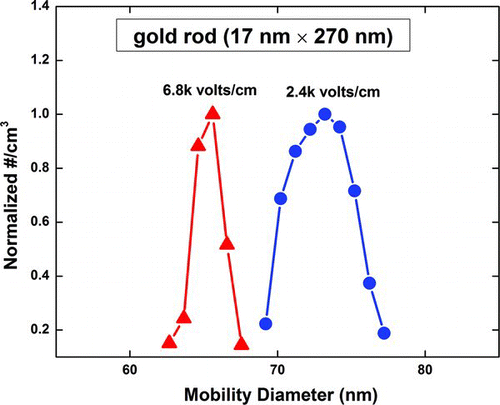
FIG. 4 Experimental measured mobility diameters for gold rods at various applied fields and compared with theoretical curves. The left two circles are measured mobility diameters at 0.833 × 10⁻⁴ m3/s (5 L/min) and 2.5 × 10⁻⁴ m3/s (15 L/min) using a long DMA, and the right four circles are measured values at 0.5 × 10⁻⁴ m3/s (3 L/min), 0.833 × 10⁻⁴ m3/s (5 L/min), 1.333 × 10⁻⁴ m3/s (8 L/min), and 1.667 × 10⁻⁴ m3/s (10 l/min) using a nano DMA. The theoretical curves of mobility diameter of a rod (diameter dr = 17 nm and length Lr = 270 nm) plotted in the free molecular and transition regime. The finite diameter of the bath gas molecules, dg = 0.3 nm, is considered by approximately increasing Lr and dr by 0.3 nm (data from Ku and de la Mora Citation2009). (Color figure available online.)
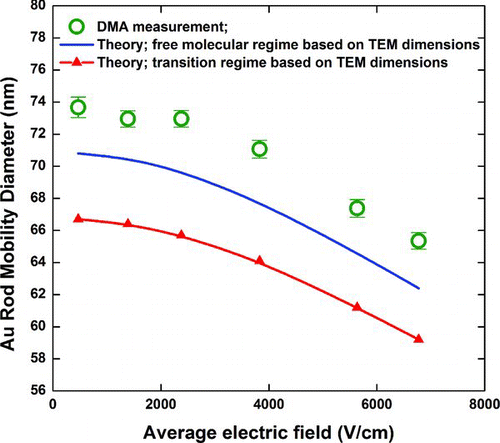
FIG. 5 Calculated ⟨cos2θ⟩ for the conducting rod (dr = 17 nm; Lr = 270 nm) and considering the finite diameter of the bath gas molecules, dg = 0.3 nm.
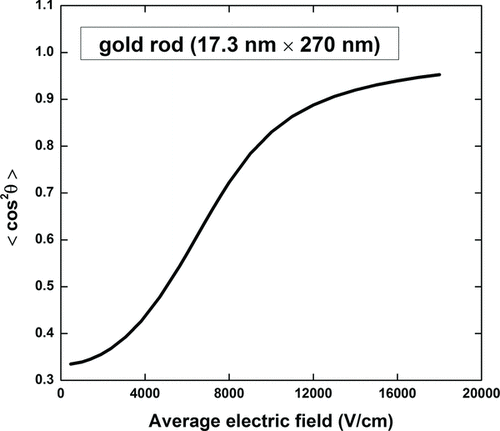
FIG. 6 Experimental measured mobility for gold rods (open squares [red]) at various applied fields, where the dimensions of the gold rods were determined by TEM (dr = 17 nm and Lr = 270 nm). Black dashed line: nonlinear least-squares fit of Equation (1) with slender conducting rod approximation based on Equation (5) gives: dr = 19 ± 0.2 nm and Lr = 261 ± 8 nm. Dotted (blue) line: full theory for rod, which is very close (the maximum deviation of mobility within the plot range is 0.16%) and overlapped with the slender approximation theory. (Color figure available online.)
![FIG. 6 Experimental measured mobility for gold rods (open squares [red]) at various applied fields, where the dimensions of the gold rods were determined by TEM (dr = 17 nm and Lr = 270 nm). Black dashed line: nonlinear least-squares fit of Equation (1) with slender conducting rod approximation based on Equation (5) gives: dr = 19 ± 0.2 nm and Lr = 261 ± 8 nm. Dotted (blue) line: full theory for rod, which is very close (the maximum deviation of mobility within the plot range is 0.16%) and overlapped with the slender approximation theory. (Color figure available online.)](/cms/asset/2f956e24-f3af-40f1-b84b-c1738670c1e2/uast_a_819565_o_f0006g.jpg)