586
Views
0
CrossRef citations to date
0
Altmetric
Original Articles

Corona-Imaging Colorimetric Method for Accurate Measurement of the Size of Water Droplets in an Expansion Chamber

, &
Pages 1134-1143 | Received 01 Feb 2013, Accepted 01 Jul 2013, Published online: 08 Aug 2013

Figures & data

FIG. 1 Schematic diagram of the CIC method used to estimate droplet diameter. The left-hand side (1–3) starts from a color image of a corona taken by a camera and leads to experimental xy standard colorimetric parameters. The right-hand side (4) is the theoretical calculation for xy as a function of particle diameter. Finally, the particle diameter is estimated by fitting experimental and theoretical xy.
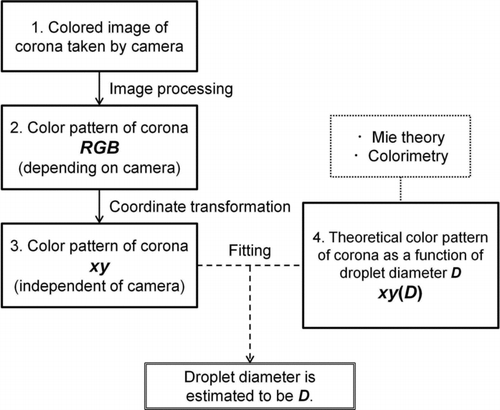
FIG. 1 Schematic diagram of the CIC method used to estimate droplet diameter. The left-hand side (1–3) starts from a color image of a corona taken by a camera and leads to experimental xy standard colorimetric parameters. The right-hand side (4) is the theoretical calculation for xy as a function of particle diameter. Finally, the particle diameter is estimated by fitting experimental and theoretical xy.

FIG. 2 Color images of the corona (a) produced by PSL particles with a diameter of 7.088 μm suspended in water and (b) produced by cloud droplets growing in the expansion chamber at a pressure of about 790 hPa. Data in the scattering angles of (a) 4.25°–9.64° and (b) 3.52°–8.59° are shown. The left half shows experimentally obtained RGB values. A background image was subtracted and RGB values were circularly averaged. The right half shows theoretically calculated RGB values.
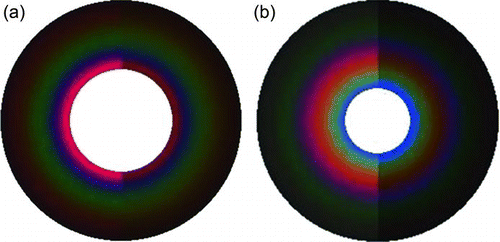
FIG. 2 Color images of the corona (a) produced by PSL particles with a diameter of 7.088 μm suspended in water and (b) produced by cloud droplets growing in the expansion chamber at a pressure of about 790 hPa. Data in the scattering angles of (a) 4.25°–9.64° and (b) 3.52°–8.59° are shown. The left half shows experimentally obtained RGB values. A background image was subtracted and RGB values were circularly averaged. The right half shows theoretically calculated RGB values.

FIG. 3 Instrumental setup of the experiment for (a) a water tank and (b) a flask (expansion chamber). Dotted lines indicate the direct beam from the light source toward the camera, and dot-dashed lines indicate examples of light paths of scattered light. Refraction of light between the water tank and the air is not shown here.
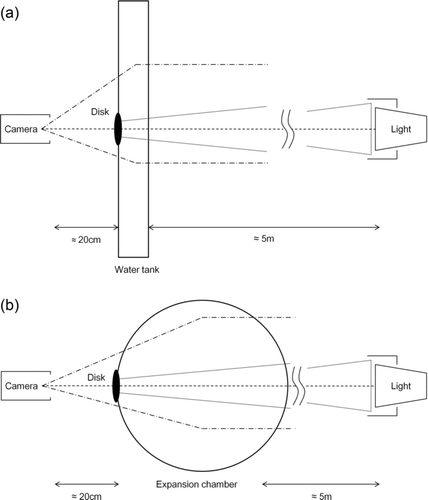
FIG. 3 Instrumental setup of the experiment for (a) a water tank and (b) a flask (expansion chamber). Dotted lines indicate the direct beam from the light source toward the camera, and dot-dashed lines indicate examples of light paths of scattered light. Refraction of light between the water tank and the air is not shown here.

FIG. 4 Schematic diagrams of the parameters for calculating scattering angles.

FIG. 4 Schematic diagrams of the parameters for calculating scattering angles.

FIG. 5 CIE 1931 color-matching functions.

FIG. 5 CIE 1931 color-matching functions.

FIG. 6 Examples of RGB and XYZ values used for determining the transformation matrix. The RGB values were obtained for PSL particles with a diameter of 7.088 μm.
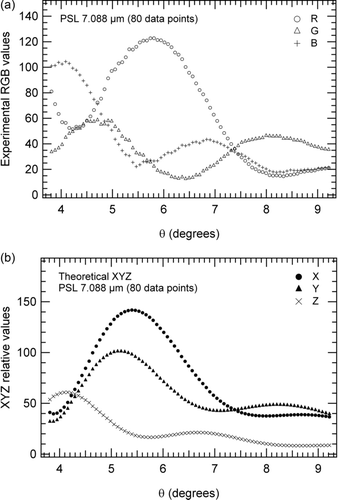
FIG. 6 Examples of RGB and XYZ values used for determining the transformation matrix. The RGB values were obtained for PSL particles with a diameter of 7.088 μm.

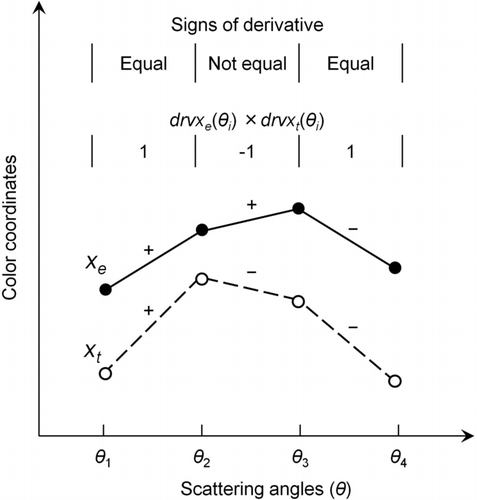
FIG. 7 Examples of originally defined parameter drvxe (θ) × drvxt (θ).

FIG. 7 Examples of originally defined parameter drvxe (θ) × drvxt (θ).

TABLE 1 Estimated PSL particle diameters

FIG. 8 Fitting parameters (FP) as a function of assumed diameter for the model calculations. Assumed diameters were given every 0.1 μm. RGB data taken with PSL particles with diameters of 7.088, 10.04, and 14.84 μm were used. The diameters of PSL particles used to derive transformation matrices are also given in individual panels. The most probable particles diameter value was estimated by the value giving the minimum FP.
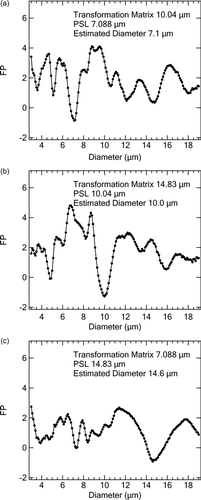
FIG. 8 Fitting parameters (FP) as a function of assumed diameter for the model calculations. Assumed diameters were given every 0.1 μm. RGB data taken with PSL particles with diameters of 7.088, 10.04, and 14.84 μm were used. The diameters of PSL particles used to derive transformation matrices are also given in individual panels. The most probable particles diameter value was estimated by the value giving the minimum FP.

FIG. 9 Angular profiles of color coordinates (normalized parameters: x and y). Open circles indicate experimentally obtained color coordinates. Solid lines indicate theoretically calculated color coordinates minimizing FP.
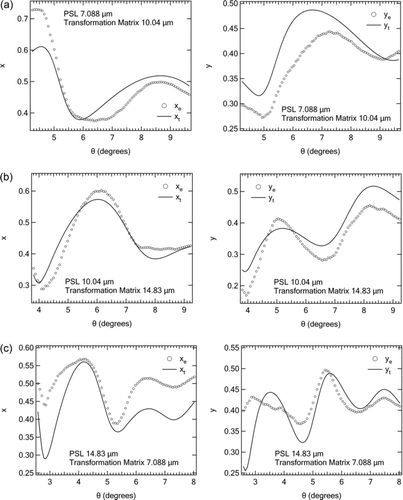
FIG. 9 Angular profiles of color coordinates (normalized parameters: x and y). Open circles indicate experimentally obtained color coordinates. Solid lines indicate theoretically calculated color coordinates minimizing FP.

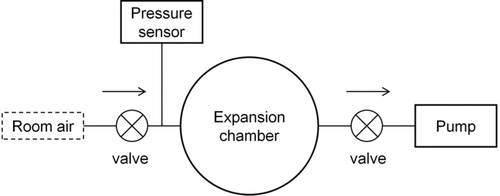
FIG. 10 Schematic diagram of the expansion chamber experiment.

FIG. 10 Schematic diagram of the expansion chamber experiment.

FIG. 11 Diameters of growing cloud droplets versus time in the expansion chamber measured by the CIC method. The starting time (0 s) was set to the time when a corona was initially detected by the camera. Closed circles indicate mean values of the three estimated diameters obtained by the use of different transformation matrices. The vertical bars indicate the minimum and the maximum values of the three diameters. Diamonds are the pressures in the chamber.
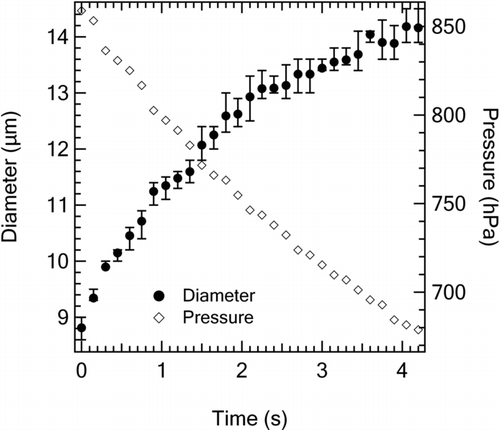
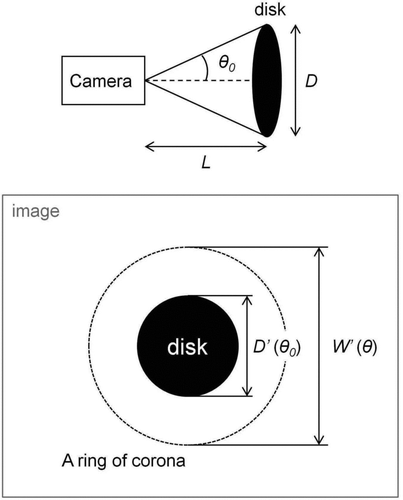
FIG. 11 Diameters of growing cloud droplets versus time in the expansion chamber measured by the CIC method. The starting time (0 s) was set to the time when a corona was initially detected by the camera. Closed circles indicate mean values of the three estimated diameters obtained by the use of different transformation matrices. The vertical bars indicate the minimum and the maximum values of the three diameters. Diamonds are the pressures in the chamber.
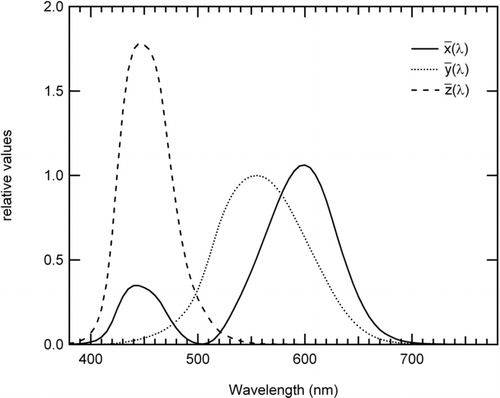
TABLE 2 The influence of polydispersity

Reprints and Corporate Permissions

Please note: Selecting permissions does not provide access to the full text of the article, please see our help page How do I view content?

To request a reprint or corporate permissions for this article, please click on the relevant link below:

Academic Permissions

Please note: Selecting permissions does not provide access to the full text of the article, please see our help page How do I view content?

Obtain permissions instantly via Rightslink by clicking on the button below:

If you are unable to obtain permissions via Rightslink, please complete and submit this Permissions form. For more information, please visit our Permissions help page.