1,047
Views
6
CrossRef citations to date
0
Altmetric
Original Article

Generation of TiO2 Aerosols from Liquid Suspensions: Influence of Colloid Characteristics

, , &
Pages 1383-1392 | Received 20 Jun 2013, Accepted 10 Aug 2013, Published online: 28 Apr 2014

Figures & data

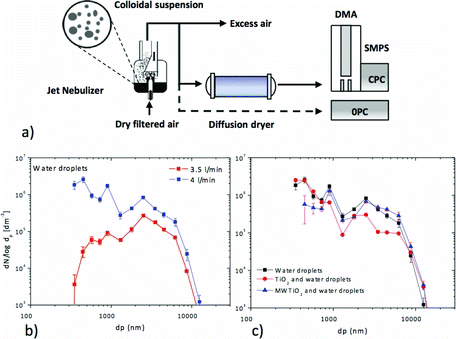
Figure 1 Scheme of the experimental setup (a) used for nanoparticle nebulization. The system generates liquid droplets with similar sizes for both pure water (b) and nanoparticle suspensions (c). Droplet size distributions were measured using an OPC without diffusion dryer in the range from 0.3 to 20 μm. (Color figure available online.)
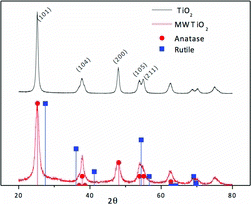
Figure 2 XRD diffraction patterns of the TiO2 and MWTiO2 nanoparticles. Anatase and rutile peak positions are shown for identification purposes. (Color figure available online.)
Figure 3 SEM images of TiO2 (a) and MWTiO2 (b) nanoparticles.

Table 1 Particle sizes in the colloidal (measured by DLS) and in aerosol state (measured by SMPS) of TiO2 and MWTiO2 at different pH values
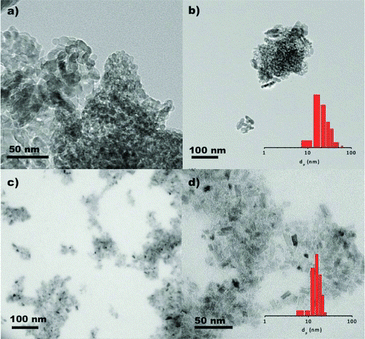
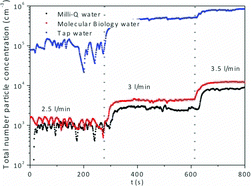
Figure 4 TEM images of TiO2 (a, b) and MWTiO2 (c, d) nanoparticles. Insets show size histograms for both nanoparticles (N > 100). (Color figure available online.)
Figure 5 Particle number total concentration (in #/cm3) of residual particles generated upon nebulization of water of different origins as function of the flow rate. (Color figure available online.)
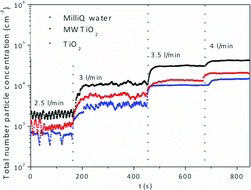
Figure 6 Particle number total concentration (in #/cm3) generated at different flow rates from the nebulization of colloidal dispersions (1 mg/ml, pH 5) of TiO2 and MWTiO2 nanoparticles. Particle number concentration from the nebulization of milli-Q water are shown for the sake of comparison. (Color figure available online.)
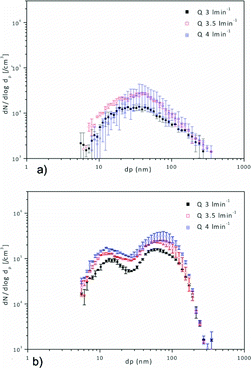
Figure 7 Particle number size distributions (in #/cm3) obtained at different nebulization flow rates of TiO2 (a) and MWTiO2 (b) from colloidal dispersions of 1 mg/ml at pH 5. (Color figure available online.)
Figure 8 SEM images of TiO2 (a, b) and MWTiO2 (c, d) nanoparticles collected on a polycarbonate filter grid at 1.2 L/min. Insets show EDX analysis. (Color figure available online.)
Figure 9 Particle number size distributions (in #/cm3) of aerosols generated from the nebulization of colloidal dispersions of TiO2 (a) and MWTiO2 (b) at different pH values. (Color figure available online.)
Supplemental material

AST_MS_2013_132_RI_SI.zip

Download Zip (779.1 KB)

Reprints and Corporate Permissions

Please note: Selecting permissions does not provide access to the full text of the article, please see our help page How do I view content?

To request a reprint or corporate permissions for this article, please click on the relevant link below:

Academic Permissions

Please note: Selecting permissions does not provide access to the full text of the article, please see our help page How do I view content?

Obtain permissions instantly via Rightslink by clicking on the button below:

If you are unable to obtain permissions via Rightslink, please complete and submit this Permissions form. For more information, please visit our Permissions help page.