1,378
Views
22
CrossRef citations to date
0
Altmetric
Original Articles

Development of a Transfer Function for a Personal, Thermophoretic Nanoparticle Sampler

, , , , , & show all

Figures & data

FIG. 1 Thermal precipitation sampler (TPS). Top panel: overall TPS device including removable sample cartridge (a), interface panel (b), and status screen (c); bottom left: oblique view of TPS sampling core containing inlet (d), pump (e), mass flow sensor (f), and associated connections; bottom right: normal section view of thermal precipitation region containing hot plate (g), TEM grid holder (h) located within the sample insertion cartridge (gray), and cold plate (i). Arrows in bottom drawings indicate direction of air flow.
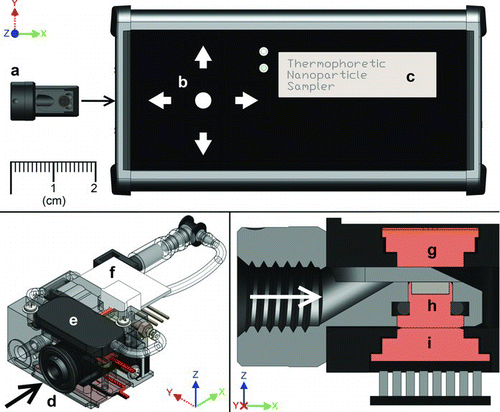
FIG. 1 Thermal precipitation sampler (TPS). Top panel: overall TPS device including removable sample cartridge (a), interface panel (b), and status screen (c); bottom left: oblique view of TPS sampling core containing inlet (d), pump (e), mass flow sensor (f), and associated connections; bottom right: normal section view of thermal precipitation region containing hot plate (g), TEM grid holder (h) located within the sample insertion cartridge (gray), and cold plate (i). Arrows in bottom drawings indicate direction of air flow.

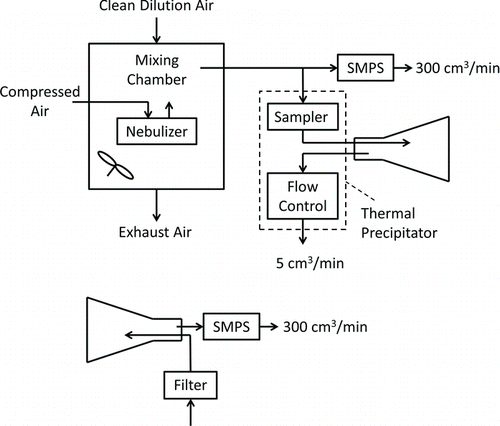
FIG. 2 Experimental setup used to measure TPS performance.

FIG. 2 Experimental setup used to measure TPS performance.

FIG. 3 STEM images of particles collected by the TPS in these tests. Note higher magnification for the image in the inset.
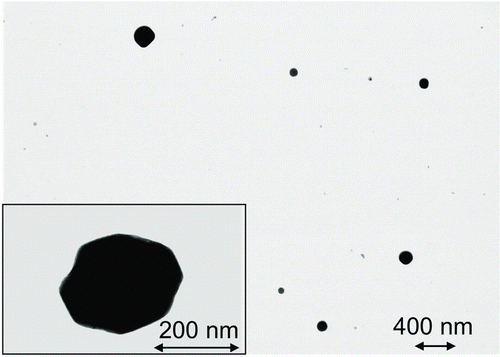
FIG. 3 STEM images of particles collected by the TPS in these tests. Note higher magnification for the image in the inset.

FIG. 4 Fractional efficiency, η(d), versus equivalent volume diameter, d ev, for sampler with thermal gradients of 85°C/mm and 55°C/mm and for sampler from theory with thermal gradient of 55°C/mm (left axis), and fractional penetration, Pt(d), for sampler inlet and outlet passages without thermal gradient (right axis). Error bars represent one standard deviation. Dotted lines are regression equations; see text.
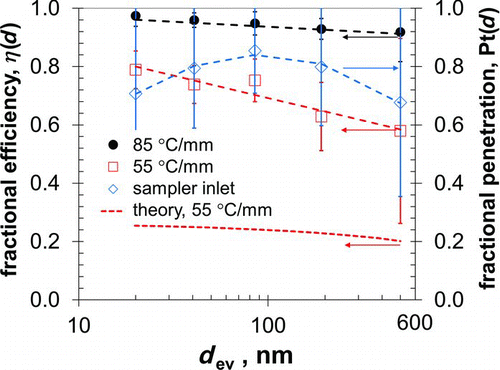
FIG. 4 Fractional efficiency, η(d), versus equivalent volume diameter, d ev, for sampler with thermal gradients of 85°C/mm and 55°C/mm and for sampler from theory with thermal gradient of 55°C/mm (left axis), and fractional penetration, Pt(d), for sampler inlet and outlet passages without thermal gradient (right axis). Error bars represent one standard deviation. Dotted lines are regression equations; see text.

FIG. 5 Normalization factor, F(d), versus equivalent volume diameter, d ev, for analyses at locations 10%, 50%, and 90% along the centerline of the TEM grid as measured in the direction of gas flow; see inset. For each particle diameter, the average F(d) for all three locations is calculated and these averages are connected by the solid line. Error bars represent one standard deviation.
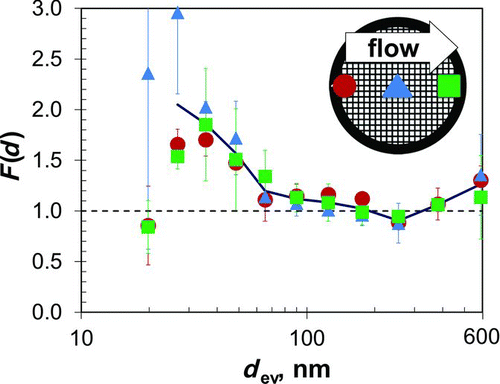
FIG. 5 Normalization factor, F(d), versus equivalent volume diameter, d ev, for analyses at locations 10%, 50%, and 90% along the centerline of the TEM grid as measured in the direction of gas flow; see inset. For each particle diameter, the average F(d) for all three locations is calculated and these averages are connected by the solid line. Error bars represent one standard deviation.