1,398
Views
12
CrossRef citations to date
0
Altmetric
Original Articles

Performance of CHROMagar VRE Medium for the Detection of Airborne Vancomycin-Resistant/Sensitive Enterococcus Species

, , , , &
Pages 173-183 | Received 23 Jul 2013, Accepted 07 Nov 2013, Published online: 26 Dec 2013

Figures & data

TABLE 1 Contingency table for air sampling performance of CVSE and CVRE

FIG. 1 Identification of E. faecalis and E. faecium in airborne field samples by gel analysis of PCR products. Lane 1: 1 kb DNA ladder; lane 2: E. faecalis; lane 3: E. faecium; lane 4: sterile water.
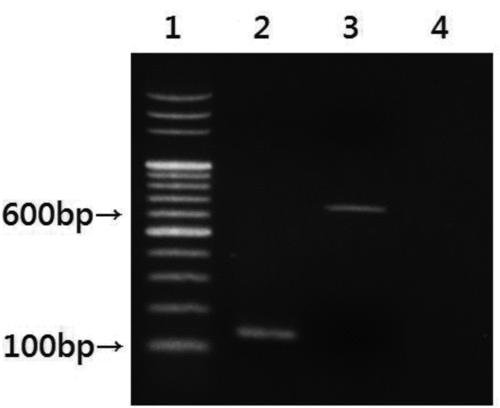
FIG. 1 Identification of E. faecalis and E. faecium in airborne field samples by gel analysis of PCR products. Lane 1: 1 kb DNA ladder; lane 2: E. faecalis; lane 3: E. faecium; lane 4: sterile water.

FIG. 2 Effects of RH on colony survival (CS) on four culture media (CVSE, LB, MH, and TSA) when collecting airborne E. faecalis using (a) an Andersen impactor and (b) a Nuclepore filter sampler. The y-axis CS represents the bacterial colony survival rate on different culture media on a logarithmic scale. Experiments were performed in triplicate, and the data shown are the mean ± standard error of the mean.
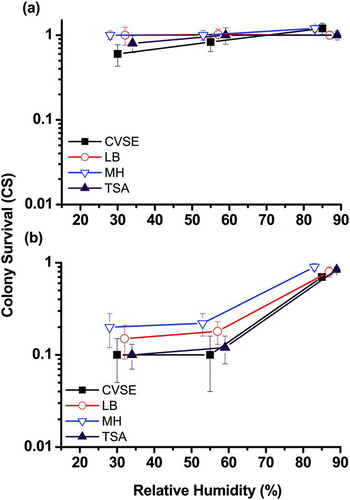
FIG. 2 Effects of RH on colony survival (CS) on four culture media (CVSE, LB, MH, and TSA) when collecting airborne E. faecalis using (a) an Andersen impactor and (b) a Nuclepore filter sampler. The y-axis CS represents the bacterial colony survival rate on different culture media on a logarithmic scale. Experiments were performed in triplicate, and the data shown are the mean ± standard error of the mean.
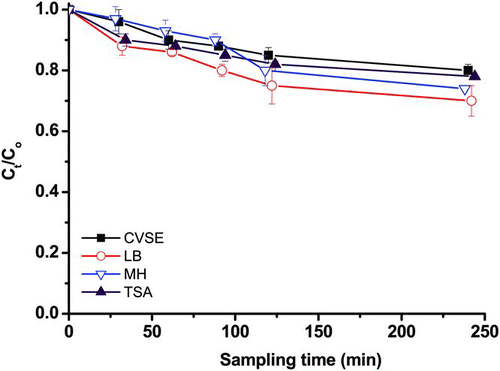
FIG. 3 Dehydration stress of E. faecalis recovered on four culture media (CVSE, LB, MH, and TSA) by closed-face filter sampling. The y-axis C t /C0 represents dehydration stress in E. faecalis induced by the Nuclepore filter sampler in arithmetic scale. Experiments were performed in triplicate, and the data shown are the mean ± standard error of the mean.

FIG. 3 Dehydration stress of E. faecalis recovered on four culture media (CVSE, LB, MH, and TSA) by closed-face filter sampling. The y-axis C t /C0 represents dehydration stress in E. faecalis induced by the Nuclepore filter sampler in arithmetic scale. Experiments were performed in triplicate, and the data shown are the mean ± standard error of the mean.

FIG. 4 Total airborne bacterial concentrations recovered on five culture media (CVSE, CVRE, LB, TSA, and MH) after sampling using (a) an Andersen impactor or (b) a Nuclepore filter sampler in an outpatient hall (H), wastewater treatment plant (W), and swine confinement-style building (S). + p < 0.05 compared to the respective H and W groups. *p < 0.05 compared to the respective LB, TSA, MH, and CVSE groups.
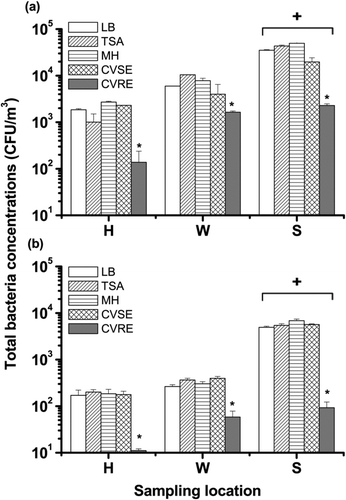
FIG. 4 Total airborne bacterial concentrations recovered on five culture media (CVSE, CVRE, LB, TSA, and MH) after sampling using (a) an Andersen impactor or (b) a Nuclepore filter sampler in an outpatient hall (H), wastewater treatment plant (W), and swine confinement-style building (S). + p < 0.05 compared to the respective H and W groups. *p < 0.05 compared to the respective LB, TSA, MH, and CVSE groups.

TABLE 2 Airborne Enterococcus concentrations recovered from different locations by Andersen impactor sampling

TABLE 3 Airborne Enterococcus concentrations recovered from different locations by Nuclepore filter sampling

FIG. 5 Distribution of vancomycin-resistant Enterococcus strains in the air of a hospital, wastewater treatment plant, and pig-rearing facility. Approximately 10% of the isolated Enterococcus strains were vancomycin-resistant, and more than half of the vancomycin-resistant strains were E. faecium.
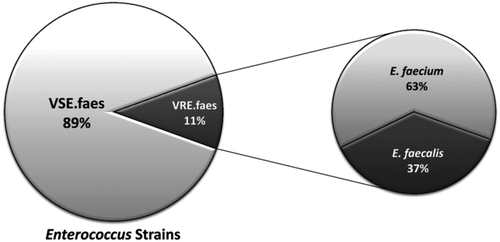
FIG. 5 Distribution of vancomycin-resistant Enterococcus strains in the air of a hospital, wastewater treatment plant, and pig-rearing facility. Approximately 10% of the isolated Enterococcus strains were vancomycin-resistant, and more than half of the vancomycin-resistant strains were E. faecium.

TABLE 4 Contingency table for air sampling performance of CVSE using conventional laboratory tests and PCR

TABLE 5 Contingency table for air sampling performance of CVRE using conventional laboratory tests and PCR

Reprints and Corporate Permissions

Please note: Selecting permissions does not provide access to the full text of the article, please see our help page How do I view content?

To request a reprint or corporate permissions for this article, please click on the relevant link below:

Academic Permissions

Please note: Selecting permissions does not provide access to the full text of the article, please see our help page How do I view content?

Obtain permissions instantly via Rightslink by clicking on the button below:

If you are unable to obtain permissions via Rightslink, please complete and submit this Permissions form. For more information, please visit our Permissions help page.