892
Views
9
CrossRef citations to date
0
Altmetric
Original Articles

Effect of Hydration and Base Contaminants on Sulfuric Acid Diffusion Measurement: A Computational Study

, , , , &
Pages 593-603 | Received 10 Sep 2013, Accepted 04 Mar 2014, Published online: 19 May 2014

Figures & data

Table 1 Clusters included in the systems studied using the B3LYP/CBSB7//RICC2/aug-cc-pV(T+d)Z cluster energies. The number of water molecules in the cluster is indicated in parenthesis. Additional clusters, that were included only in the simulations where the system was extended to clusters containing up to two H2SO4 and two base molecules, are marked with an asterisk; otherwise only clusters containing up to one H2SO4 and one base molecule were included
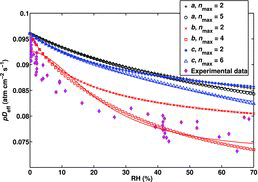
Figure 1 Flowchart of the procedure and methods implemented in this study.
Figure 2 Effective diffusion coefficient as a function of RH for the system containing only single sulfuric acid molecules and its hydrates H2SO4•(H2O)n, with n = 0−2 and n = 0−nmax, calculated using (a) B3LYP/CBSB7//RICC2/aug-cc-pV(T+d)Z (nmax = 5; plus signs and circles), (b) MP2/aug-cc-pV(D+d)Z//ΔE0,3-step (nmax = 4; x's and squares), and (c) RI-MP2/aug-cc-pVDZ//RI-MP2/CBS (nmax = 6; asterisks and triangles) Gibbs free energies.
Figure 3 Effective diffusion coefficient as a function of RH for the system containing H2SO4, base, and H2SO4•base species and their hydrates at varying initial RH-independent base concentration when the base is DMA (top panel) and TMA (bottom panel), calculated using the B3LYP/CBSB7//RICC2/aug-cc-pV(T+d)Z Gibbs free energies.
Figure 4 Effective diffusion coefficient as a function of RH for the system containing H2SO4, base, and H2SO4•base species and their hydrates at RH-dependent base concentration and varying initial H2SO4 concentration when the base is DMA (top panel) and TMA (bottom panel), calculated using the B3LYP/CBSB7//RICC2/aug-cc-pV(T+d)Z Gibbs free energies. The shaded (green) area presents the spread of the results for pDeff as the initial H2SO4 concentration varies between 3 × 107 cm−3 and 3 × 109 cm−3.
Figure 5 Effective diffusion coefficient as a function of RH for the H2SO4–DMA system extended to include larger clusters, calculated using the B3LYP/CBSB7//RICC2/aug-cc-pV(T+d)Z Gibbs free energies. The shaded (green) area presents the spread of the results for pDeff as the initial H2SO4 concentration varies between 3 × 107 cm−3 and 3 × 109 cm−3. The upper limit of the shaded area corresponds to [H2SO4]init = 4 × 108 cm−3.

Table 2 Equilibrium constants K1 and K2 obtained from the fits (EquationEquation (2)) to the theoretical effective diffusion coefficients presented in Figures 2–5, and their changes ΔK1 and ΔK2 with respect to the actual input values, defined as ΔKn = (Kn,fitKn,input)/Kn,input, for the systems where the changes in the simulation result were significant (note that the constants are not at the standard state of 1 atm). 95% confidence bounds for the absolute values Kn are stated in the parenthesis. N/A indicates that the fit could not be unambiguously applied because the initial acid and base concentrations as a function of RH are not known; Kn corresponding to specific concentrations are given in the square brackets

Supplemental material

Olenius_Diffusion_SI.zip

Download Zip (491.7 KB)

Reprints and Corporate Permissions

Please note: Selecting permissions does not provide access to the full text of the article, please see our help page How do I view content?

To request a reprint or corporate permissions for this article, please click on the relevant link below:

Academic Permissions

Please note: Selecting permissions does not provide access to the full text of the article, please see our help page How do I view content?

Obtain permissions instantly via Rightslink by clicking on the button below:

If you are unable to obtain permissions via Rightslink, please complete and submit this Permissions form. For more information, please visit our Permissions help page.