837
Views
4
CrossRef citations to date
0
Altmetric
Original Articles

On the Feasibility of a Number Concentration Calibration Using a Wafer Surface Scanner

, , , , &
Pages 747-757 | Received 04 Feb 2014, Accepted 18 Apr 2014, Published online: 25 Jun 2014

Figures & data

FIG. 1. Schematic of the system for calibrating an OPC by depositing 3-μm PSL spheres on a silicon wafer. Additional instrumentation used for optimizing the virtual impactor performance and for determining the reduction in residue particles by the DMA is indicated by the dashed lines.
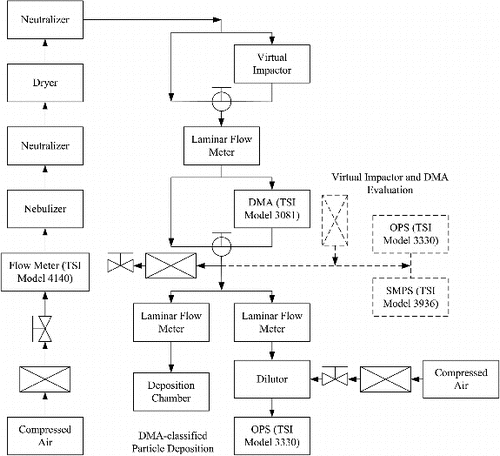
FIG. 1. Schematic of the system for calibrating an OPC by depositing 3-μm PSL spheres on a silicon wafer. Additional instrumentation used for optimizing the virtual impactor performance and for determining the reduction in residue particles by the DMA is indicated by the dashed lines.

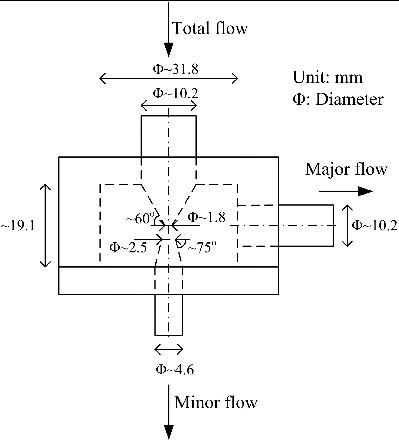
FIG. 2. Schematic of the virtual impactor used to increase the concentration of 3-μm PSL spheres.

FIG. 2. Schematic of the virtual impactor used to increase the concentration of 3-μm PSL spheres.

FIG. 3. Particle concentration with respect to particle diameter for the aerosol upstream and downstream of the virtual impactor operated at a total flow rate of 50 cm3/s and a minor exit flow rate of 5.83 cm3/s.
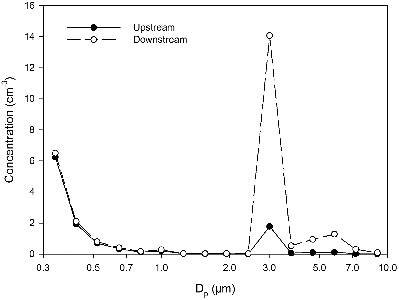
FIG. 3. Particle concentration with respect to particle diameter for the aerosol upstream and downstream of the virtual impactor operated at a total flow rate of 50 cm3/s and a minor exit flow rate of 5.83 cm3/s.

FIG. 4. Schematic of the deposition chamber. The outlets are indicated by the dotted lines near the two arrows.
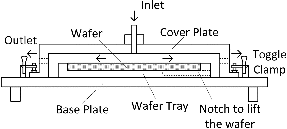
FIG. 4. Schematic of the deposition chamber. The outlets are indicated by the dotted lines near the two arrows.

FIG. 5. Map of the xy coordinates and size for each particle deposited on the wafer. The 3-μm spheres (small circles) are deposited within a 4.51-cm radius dashed circle at the lower flow of 1.83 cm3/s for wafer 4, 6/12 (upper map) and within a 5.11-cm radius at the larger flow of 2.35 cm3/s for wafer 5, 6/26 (lower map). The dark marks on the lower wafers indicate scratches on the wafer surface.
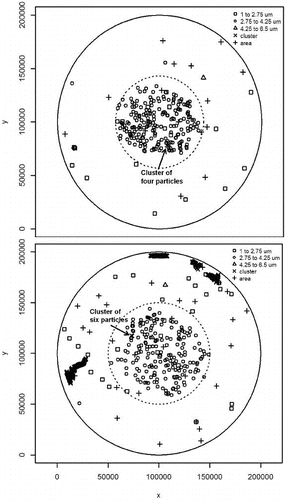
FIG. 5. Map of the x–y coordinates and size for each particle deposited on the wafer. The 3-μm spheres (small circles) are deposited within a 4.51-cm radius dashed circle at the lower flow of 1.83 cm3/s for wafer 4, 6/12 (upper map) and within a 5.11-cm radius at the larger flow of 2.35 cm3/s for wafer 5, 6/26 (lower map). The dark marks on the lower wafers indicate scratches on the wafer surface.

FIG. 6. Average fractional density of particles deposited on the wafer at lower flow (data indicated by circles) and higher flow (data indicated by squares). The error bars correspond to the standard deviations based on nine wafers for the lower flow and three wafers for the higher flow. Where the two sets of error bars overlap, the low flow error bars are larger except for the densities at 3.25 cm.
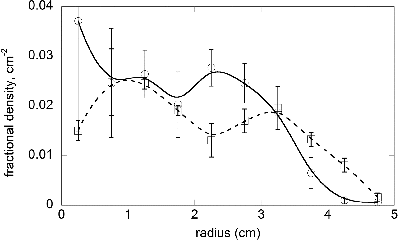
FIG. 6. Average fractional density of particles deposited on the wafer at lower flow (data indicated by circles) and higher flow (data indicated by squares). The error bars correspond to the standard deviations based on nine wafers for the lower flow and three wafers for the higher flow. Where the two sets of error bars overlap, the low flow error bars are larger except for the densities at 3.25 cm.

TABLE 1 Wafer surface scanner count distribution for 12 depositions

TABLE 2 Comparison of the OPC results with the wafer surface scanner results

FIG. 7. Bin distribution of 3-μm spheres for the WSS (three bins) and for the OPC (two bins), based on 180 s of deposition for Experiment 4. The total number of spheres counted, which is equal to the area under the curve, was 209 for the WSS and 213 for the OPC. The two narrowly spaced lines between the arrows correspond to ±1 standard deviation of the size distribution of the PSL spheres about the number mean size (3.00 μm) obtained by particle manufacturer, Thermo Scientific.
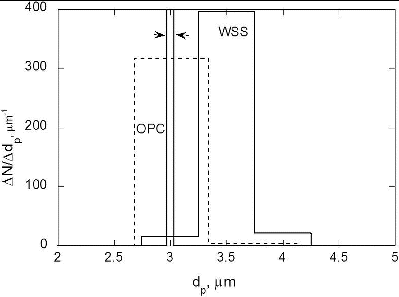
FIG. 7. Bin distribution of 3-μm spheres for the WSS (three bins) and for the OPC (two bins), based on 180 s of deposition for Experiment 4. The total number of spheres counted, which is equal to the area under the curve, was 209 for the WSS and 213 for the OPC. The two narrowly spaced lines between the arrows correspond to ±1 standard deviation of the size distribution of the PSL spheres about the number mean size (3.00 μm) obtained by particle manufacturer, Thermo Scientific.

FIG. 8. The WSS/OPC ratios are plotted with respect to the WSS concentrations. The solid line represents the average value of the concentration.
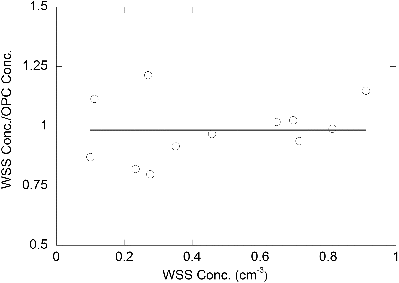
FIG. 8. The WSS/OPC ratios are plotted with respect to the WSS concentrations. The solid line represents the average value of the concentration.

FIG. 9. Linear regression with intercept (solid line, slope = 1.075, intercept = −0.033) and without (solid line, slope = 1.022) for the OPC concentration versus deposition chamber inlet concentration. The error bars correspond to the 95% confidence interval for the linear regression with intercept.
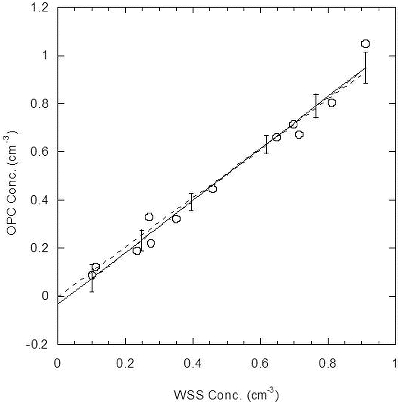
FIG. 9. Linear regression with intercept (solid line, slope = 1.075, intercept = −0.033) and without (solid line, slope = 1.022) for the OPC concentration versus deposition chamber inlet concentration. The error bars correspond to the 95% confidence interval for the linear regression with intercept.
Reprints and Corporate Permissions

Please note: Selecting permissions does not provide access to the full text of the article, please see our help page How do I view content?

To request a reprint or corporate permissions for this article, please click on the relevant link below:

Academic Permissions

Please note: Selecting permissions does not provide access to the full text of the article, please see our help page How do I view content?

Obtain permissions instantly via Rightslink by clicking on the button below:

If you are unable to obtain permissions via Rightslink, please complete and submit this Permissions form. For more information, please visit our Permissions help page.