1,088
Views
0
CrossRef citations to date
0
Altmetric
Original Articles

Synthesis of Porous Particles of SOFC Anode and Cathode Materials by Citric Acid-Addition Ultrasonic Spray Pyrolysis (CA-USP)

, , &
Pages 1089-1098 | Received 16 Jan 2014, Accepted 06 Aug 2014, Published online: 31 Aug 2014

Figures & data

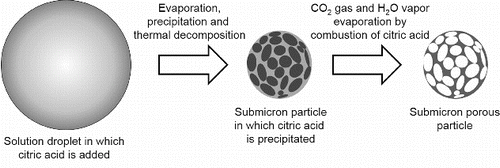
FIG. 1. Concept of citric acid-addition ultrasonic spray pyrolysis (CA-USP).

FIG. 1. Concept of citric acid-addition ultrasonic spray pyrolysis (CA-USP).

FIG. 2. Temperature profiles in the reactor at Tf1 = 673 K, Tf2 = 873, 1073, and 1273 K, and Q = 5 L min−1.
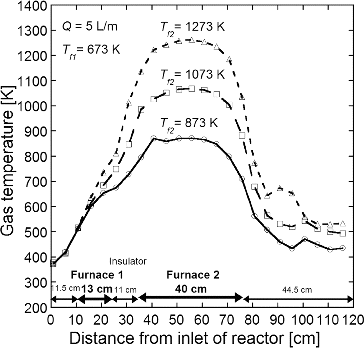
FIG. 2. Temperature profiles in the reactor at Tf1 = 673 K, Tf2 = 873, 1073, and 1273 K, and Q = 5 L min−1.

TABLE 1 Average crystallite sizes Dcry obtained from XRD patterns for NiO-GDC, LSC, and LCM particles shown in Figure 4

FIG. 3. XRD patterns of (a) NiO-GDC, (b) LSC, and (c) LCM powders synthesized at Ctotal = Cc = 0.2 mol L−1, Tf1 = 673 K, Tf2 = 1273 K, and tr = 16 s with JCPDS 78-0643 of NiO and JCPDS 78-0161 of GDC, JCPDS 36-1392 of LSC, and JCPDS 44-1040 of LCM (white and black bars).
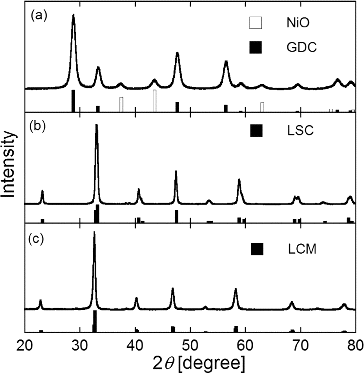
FIG. 3. XRD patterns of (a) NiO-GDC, (b) LSC, and (c) LCM powders synthesized at Ctotal = Cc = 0.2 mol L−1, Tf1 = 673 K, Tf2 = 1273 K, and tr = 16 s with JCPDS 78-0643 of NiO and JCPDS 78-0161 of GDC, JCPDS 36-1392 of LSC, and JCPDS 44-1040 of LCM (white and black bars).

TABLE 2 Geometric mean diameters Dpg and geometric standard deviations σg obtained from SEM images of NiO-GDC, LSC, and LCM particles shown in Figure 5

FIG. 4. SEM images of (a) NiO-GDC, (b) LSC, and (c) LCM powders synthesized at Cc = 0 mol L−1 and (d) NiO-GDC, (e) LSC, and (f) LCM powders synthesized at Cc = 0.2 mol L−1. (Ctotal = 0.2 mol L−1, Tf1 = 673 K, Tf2 = 1273 K, and tr = 16 s.)
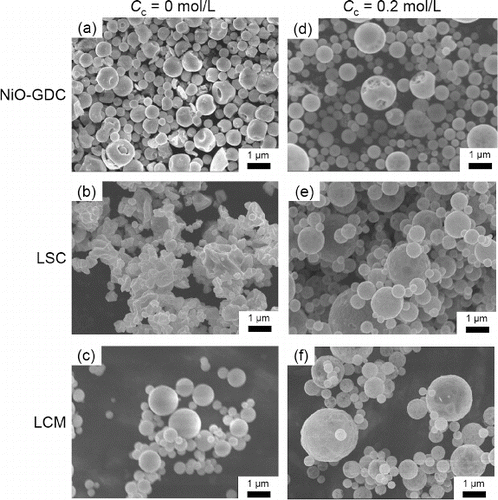
FIG. 4. SEM images of (a) NiO-GDC, (b) LSC, and (c) LCM powders synthesized at Cc = 0 mol L−1 and (d) NiO-GDC, (e) LSC, and (f) LCM powders synthesized at Cc = 0.2 mol L−1. (Ctotal = 0.2 mol L−1, Tf1 = 673 K, Tf2 = 1273 K, and tr = 16 s.)

FIG. 5. TEM images of NiO-GDC, LSC, and LCM powders synthesized at Cc = 0 mol L−1 and Cc = 0.2 mol L−1. (Ctotal = 0.2 mol L−1, Tf1 = 673 K, Tf2 = 1273K, and tr = 16 s.)
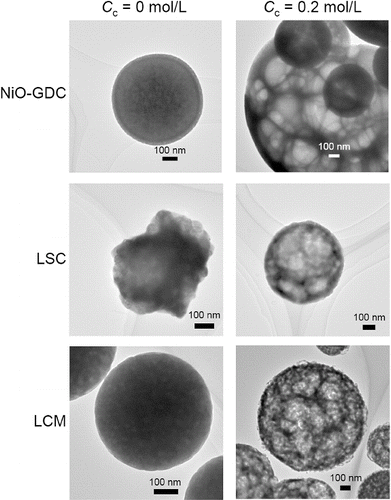
FIG. 5. TEM images of NiO-GDC, LSC, and LCM powders synthesized at Cc = 0 mol L−1 and Cc = 0.2 mol L−1. (Ctotal = 0.2 mol L−1, Tf1 = 673 K, Tf2 = 1273K, and tr = 16 s.)

TABLE 3 Specific surface areas Sw obtained from N2 adsorption isotherms of NiO-GDC, LSC, and LCM particles

FIG. 6. High magnification SEM images of NiO-GDC, LSC, and LCM powders synthesized at Cc = 0 mol L−1 and Cc = 0.2 mol L−1. (Ctotal = 0.2 mol L−1, Tf1 = 673 K, Tf2 = 1273 K and tr = 16 s.)
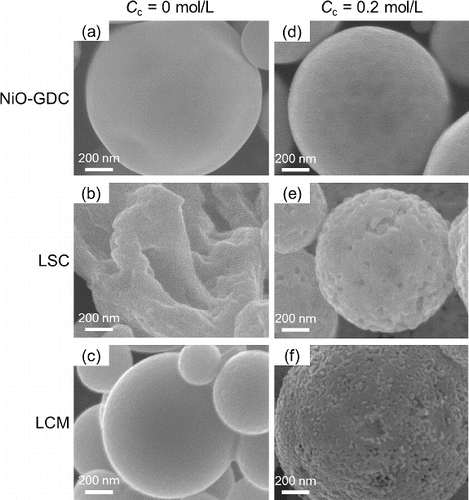
FIG. 6. High magnification SEM images of NiO-GDC, LSC, and LCM powders synthesized at Cc = 0 mol L−1 and Cc = 0.2 mol L−1. (Ctotal = 0.2 mol L−1, Tf1 = 673 K, Tf2 = 1273 K and tr = 16 s.)

FIG. 7. EDX images of NiO-GDC particles synthesized at Cc = 0 mol L−1 and Cc = 0.2 mol L−1. (Ctotal = 0.2 mol L−1, Tf1 = 673 K, Tf2 = 1273 K, and tr = 16 s.)
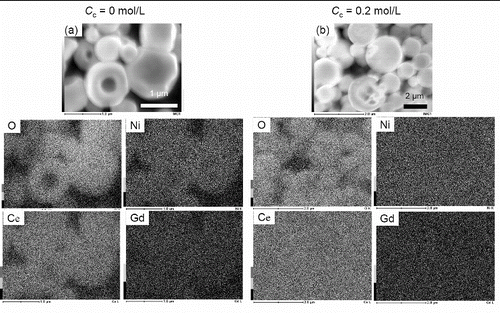
FIG. 7. EDX images of NiO-GDC particles synthesized at Cc = 0 mol L−1 and Cc = 0.2 mol L−1. (Ctotal = 0.2 mol L−1, Tf1 = 673 K, Tf2 = 1273 K, and tr = 16 s.)

FIG. 8. Number size distributions of (a) NiO-GDC and (b) LCM particles measured by DLS before (solid lines) and after (dotted lines) a 2-h ball mill grinding. Particles were synthesized at Ctotal = Cc = 0.2 mol L−1, Tf1 = 673 K, Tf2 = 1273 K, and tr = 16 s.
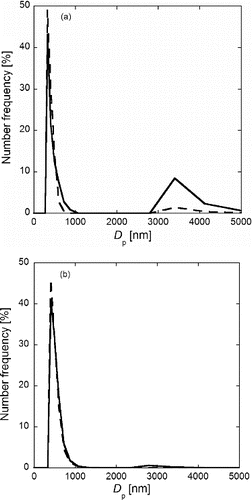
FIG. 8. Number size distributions of (a) NiO-GDC and (b) LCM particles measured by DLS before (solid lines) and after (dotted lines) a 2-h ball mill grinding. Particles were synthesized at Ctotal = Cc = 0.2 mol L−1, Tf1 = 673 K, Tf2 = 1273 K, and tr = 16 s.

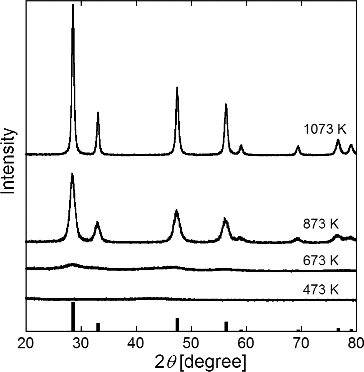
FIG. 9. XRD patterns of GDC particles synthesized at Tf1 = 673 K, Tf2 = 473, 673, 873, and 1073 K (Ctotal = Cc = 0.2 mol L−1 and tr = 16 s) with JCPDS 78-0161 of GDC (black bars).

FIG. 9. XRD patterns of GDC particles synthesized at Tf1 = 673 K, Tf2 = 473, 673, 873, and 1073 K (Ctotal = Cc = 0.2 mol L−1 and tr = 16 s) with JCPDS 78-0161 of GDC (black bars).

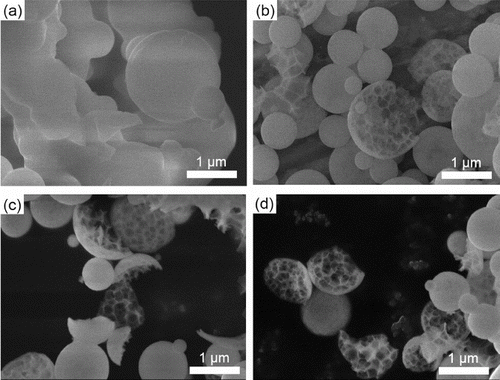
FIG. 10. SEM images of GDC particles synthesized at Tf1 = 673 K, Tf2 = (a) 473, (b) 673, (c) 873, and (d) 1073 K. Ctotal = Cc = 0.2 mol L−1, and tr = 16 s.

FIG. 10. SEM images of GDC particles synthesized at Tf1 = 673 K, Tf2 = (a) 473, (b) 673, (c) 873, and (d) 1073 K. Ctotal = Cc = 0.2 mol L−1, and tr = 16 s.

Reprints and Corporate Permissions

Please note: Selecting permissions does not provide access to the full text of the article, please see our help page How do I view content?

To request a reprint or corporate permissions for this article, please click on the relevant link below:

Academic Permissions

Please note: Selecting permissions does not provide access to the full text of the article, please see our help page How do I view content?

Obtain permissions instantly via Rightslink by clicking on the button below:

If you are unable to obtain permissions via Rightslink, please complete and submit this Permissions form. For more information, please visit our Permissions help page.