Figures & data
FIG. 1 Chromatogram of typical ambient atmospheric sample from TAG. The sample is composed of resolved peaks (compounds), column bleed from the column phase (shown here in a system blank), and the remainder of the sample signal is the Unresolved Complex Mixture (UCM) that is composed of hundreds of co-eluting compounds.
FIG. 2 The binning method for TAG chromatograms is to evenly divide the chromatogram by time including both the resolved peaks and the UCM. Using this method, the UCM dominates the signal.
FIG. 3 Schematic of the TAG binning data matrix [X] for use in PMF analysis: n is the number of chromatogram for each hour; b is bin number for each chromatogram bin; m is the index of m/z.
![FIG. 3 Schematic of the TAG binning data matrix [X] for use in PMF analysis: n is the number of chromatogram for each hour; b is bin number for each chromatogram bin; m is the index of m/z.](/cms/asset/63c76a04-957c-49c4-9055-46389fc85979/uast_a_967832_f0003_b.gif)
FIG. 4 TAG SOAR sampling sequence and TAG binning datasets.
Table 1 PMF Q/Qexp value of TAG-400Bin-Ambient dataset for different PMF error methods: IC and MDL error methods
FIG. 5 Correlations (R) of TAG-400Bin-Ambient time series with AMS HOA and OOA time series. Comparison was made among different PMF error methods: ion counting (IC) error method, which is the PMF error method for AMS data; and MDL error method. Different percentage in MDL method is the TAG measurement standard deviation, which is different for different compound.
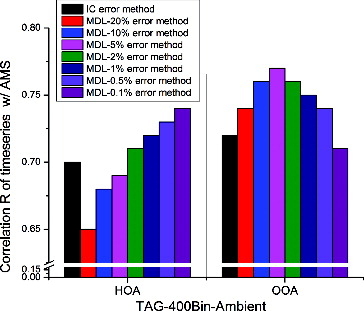
FIG. 6 Correlations (R) of TAG-Bin-Ambient and TAG-Bin-Particle-Pre time series with AMS HOA and OOA time series. Comparison was made among different bins: from 20 to 5200 bin. MDL-2% error method was used here.
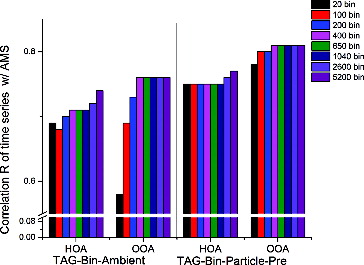
FIG. 7 Scatter plot of TAG versus AMS: (a) HOA; (b) OOA. Comparisons were made among TAG three choices: TAG-Bin-Ambient, TAG-Bin-Particle-Pre, and TAG-Integrated-Particle. 5200 bin and MDL-2% were used for TAG-Bin-Ambient and TAG-Bin-Particle-Pre.
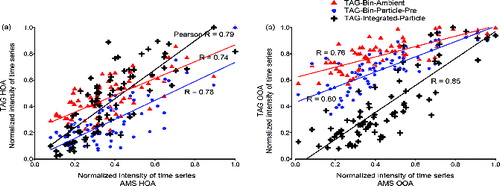
FIG. 8 (1–20) Averaged chromatograms for Factor 1–20 (F1-F20) in PMF 20 factor solution on TAG-400Bin-Particle-Pre with MDL 2% error method.
FIG. 8 (Continued)
FIG. 9 (1–20) Mass spectra for Factor 1–20 (F1-F20) in PMF 20 factor solution on TAG-400Bin-Particle-Pre with MDL 2% error method.
FIG. 9 (Continued)
FIG. 10 Correlations (R) of time series from comparison of 20 factor solution of TAG-400Bin-Particle-Pre (Figures 8 and 9) with 6 factors of AMS: HOA (Hydrocarbon-like OA), LOA-AC (Amine-Containing Local-OA), LOA-2 (Local-OA 2), MV-OOA (Medium-Volatility Oxygenated-OA), SV-OOA (Semi-Volatile Oxygenated-OA), and cLV-OOA (composite Low-Volatility Oxygenated-OA).