
Figures & data
FIG. 1. Experimental setup. Components inside the dashed line were not used during every test.
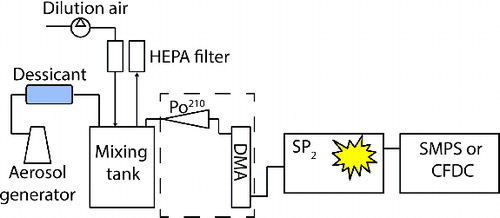
TABLE 1 Fraction of particles with an incandescence signal (finc). Ratio of total number and volume concentrations as well as number and volume concentrations for particles less than 70 nm and more than 100 nm in diameter with the laser on to off for the SP2-SMPS tests. All values were averaged over three on:off cycles
FIG. 2. Number size distribution of PSL (a), Aquadag (b), and ATD (c) sampled through the SP2 with laser off (blue) and on (red).
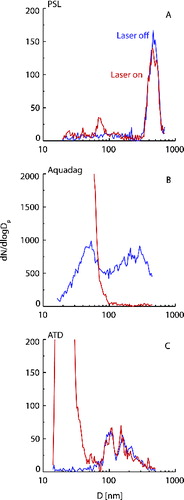
FIG. 3. Fractional change due to SP2 laser processing in NINP (light blue symbols) and N500 (black symbols) for test particles of kaolinite, organic alfalfa soil, 600 nm Aquadag, mixed 600 nm kaolinite and Aquadag, and smoke from the laboratory combustion of wiregrass during FLAME 4. Error bars represent variability calculated from the standard error of the mean during the averaging period.
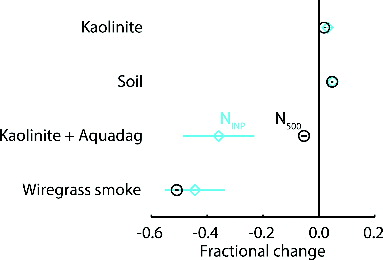
FIG. 4. Incandescence versus scattering signal peak heights measured by the SP2 for 600 nm Aquadag (a) and mixed 600 nm kaolinite and Aquadag (b) test particles. Red colors indicate high-point density and blue low-point density. The solid line indicates the local minimum between the unmixed Aquadag and mixed aerosol modes.
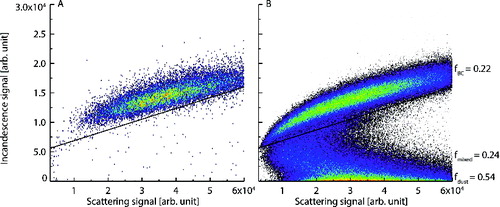
FIG. 5. N500 (top) and NINP (bottom) during a FLAME 4 wiregrass burn measured with SP2 laser off (blue) and on (red). Filled points indicate averages for each laser off or on time period, while open symbols are 1 Hz CFDC data.
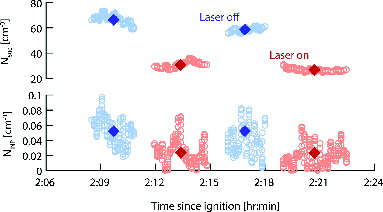
FIG. 6. rBC-INP number concentrations [L−1] as a function of rBC active fraction and rBC total number concentration in various expected atmospheric situations.
![FIG. 6. rBC-INP number concentrations [L−1] as a function of rBC active fraction and rBC total number concentration in various expected atmospheric situations.](/cms/asset/78af1c0c-8394-43a8-a8a3-4a5ae58b309d/uast_a_977843_f0006_oc.jpg)