Figures & data
FIG. 1. (a) Formation of a fluorescent product upon reaction of BPEAnit with a radical; (b) an example of fluorescence spectra of BPEAnit upon sonication in DMSO; (c) average ROS/radical concentrations for different sonication times. The experiment was repeated 3 times and the error bars present one standard deviation.
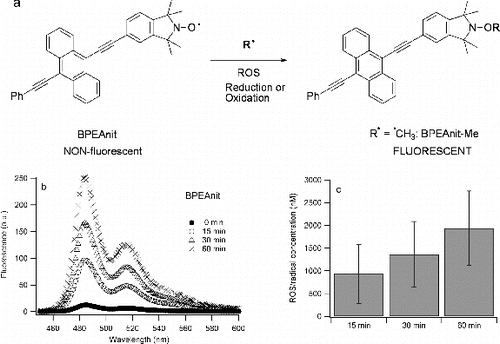
FIG. 2. (a) Hydrolysis of DCFH-DA and ROS-induced oxidation of DCFH; (b) an example of fluorescence spectra of DCFH upon sonication in 10% ethanol/90% water in the presence of HRP; (c) average ROS concentrations for different sonication times. The experiment is repeated 3 times and error bars present one standard deviation.
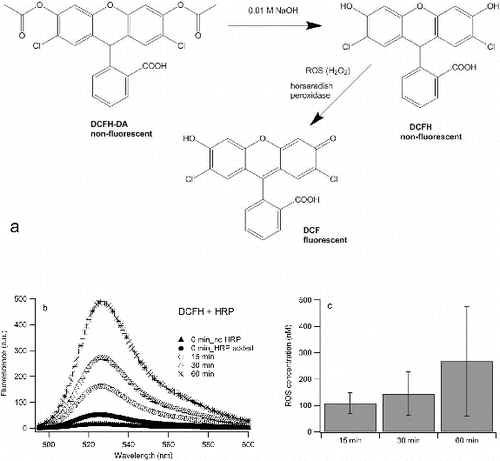
FIG. 3. (a) Oxidation of DTT; (b) absorbance spectra of oxidized DTT upon sonication in water; (c) absorption of oxidized DTT at 270 nm (λmax).
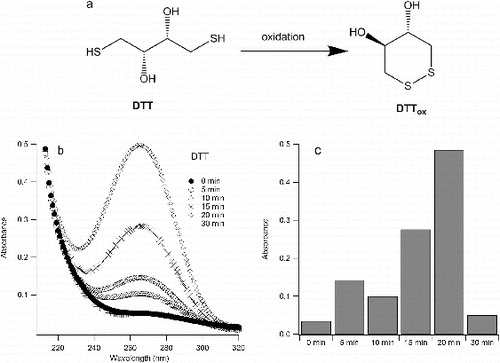
FIG. 4. Fluorescence intensity at 485 nm of BPEAnit upon sonication in DMSO.
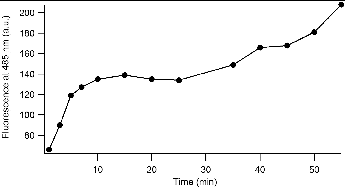
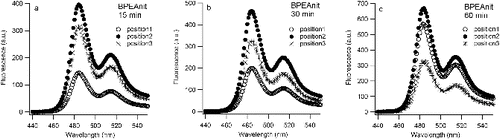
FIG. 5. Fluorescence spectra of BPEAnit (a, b, and c) at three different positions (position 1: left, position 2: middle, and position 3: right) in the ultrasonic bath upon simultaneous sonication for 15, 30, and 60 min. Fluorescence spectra at t = 0 min was the same for all three solutions, with intensity of 10 a.u. at 485 nm (fluorescence maximum).