
Figures & data
TABLE 1 The list of measured filters and their porosity and DOP values (as available from manufacturers)
FIG. 1. The schematics of the filter tester used in this study.
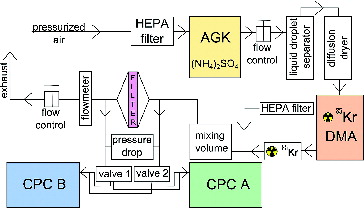
FIG. 2. Size-resolved penetration of submicron particles challenging the filter media.
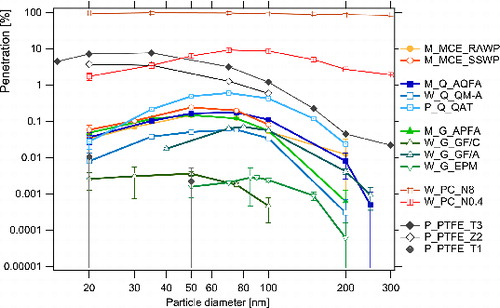
TABLE 2 Maxima of penetration, MPPS and fit widths, and pressure drops (at the face velocity of 40 cm/s) for all measured filters
FIG. 3. (a) The dependence of the penetration on the MPPS for individual filters, divided into groups according to the type of filtration material. (b) Same as (a) for the dependence of the penetration on the pressure drop. The filled area is only for better readability of the plots.
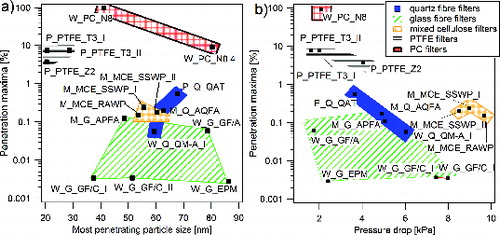
FIG. 4. The dependence of the penetrations through a Zefluor 2 μm filter on face velocity. The lines only connect the measured data for better visualization of the data.
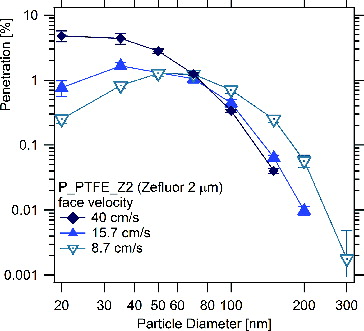
FIG. 5. The comparisons of the penetrations through various filters of the same types but of different batch numbers.
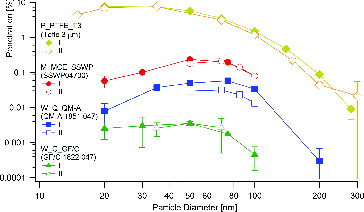
TABLE 3 Dependence of the pressure drop across the filter on the sample face velocity
TABLE 4 Comparison of computed and measured maximal penetration through the Zefluor 2 μm filter