Figures & data
FIG. 1. Configuration of the chamber studied by Zhang et al. (Citation2009).
TABLE 1 Cases designed to verify the method of estimating the necessary particle number
FIG. 2. Particle number independence tests for (a) Case 1, (b) Case 2, and (c) Case 3.
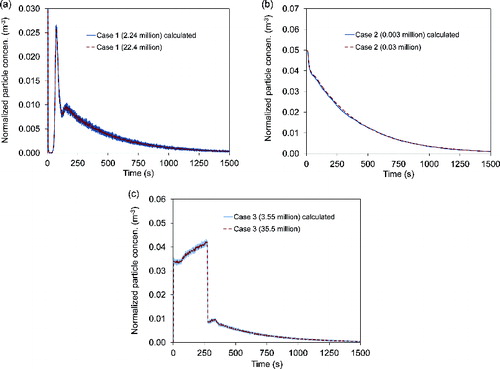
FIG. 3. Comparison of normalized particle concentrations predicted by the combined Lagrangian and superimposition method and the pure Lagrangian method.
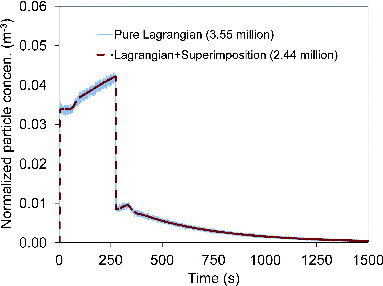
FIG. 4. Factor of reduction in particle number as a function of particle source duration when the superimposition method is used.
FIG. 5. Comparison of normalized particle concentrations predicted by the combined Lagrangian and time-averaging method and the pure Lagrangian method for (a) Case 1 and (b) Case 3.
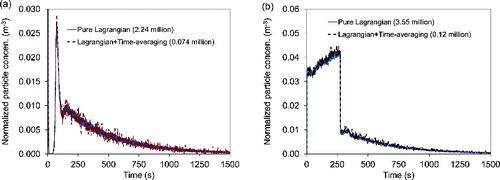
FIG. 6. Comparison of normalized particle concentrations predicted by the combined Lagrangian, superimposition, and time-averaging method and the pure Lagrangian method.
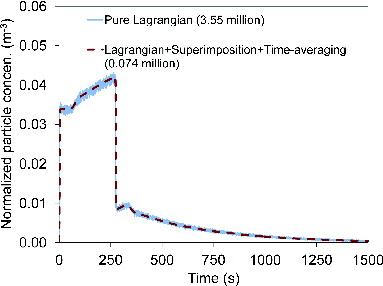
TABLE 2 Comparison of computing cost
FIG. 7. Comparison of the numerical results for transient particle concentration with the corresponding experimental data: (a) Point 1 and (b) Point 2.
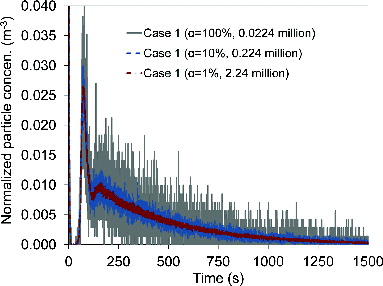
FIG. 8. Comparison of normalized particle concentrations predicted by the Lagrangian method with particle numbers that were estimated using α values of 1%, 10%, and 100%.