Figures & data
TABLE 1 Refractory black carbon (rBC) materials sampled in this work
FIG. 1. Normalized positive ion mass spectra for (a) Regal black, (b) ethylene soot, (c) Nano-C fullerene black, and (d) C60. Mass spectra represent the measured refractory carbon ion count rate (Hz) normalized to the total carbon ion signal as a function of mass-to-charge ratio (m/z) up to 2000 m/z. The displayed m/z scale corresponds to carbon cluster ions from C1+ (12 m/z) to C166+ (1992 m/z) as shown on top axis. The C1+–C5+ region has been expanded for clarity. The top of the figure shows the SP-AMS mass spectrometric categories and the related structures for stable carbon clusters.
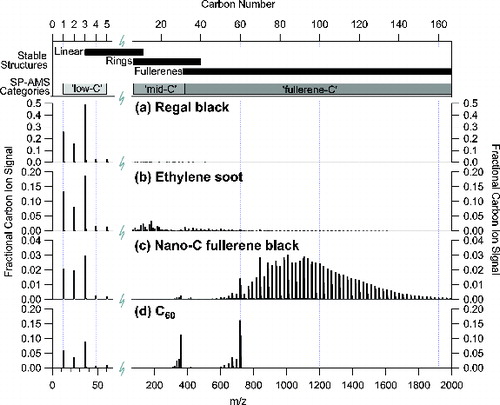
FIG. 2. Positive carbon ion mass spectra measured in (a) exhaust emissions from a single on-road diesel truck, and (b) smoke from the biomass burning of lodgepole pine. The C1+–C5+ region (1–60 m/z) has been expanded for clarity, and the intensity scales for the C6+ to C83+ region (60–1000 m/z) have been expanded to 1:10 (right axes).
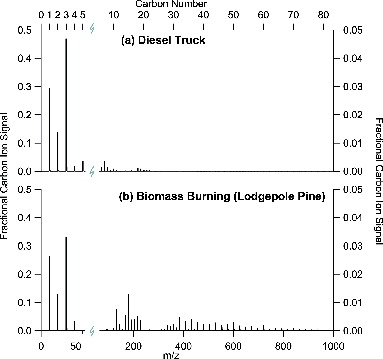
FIG. 3. (a) Normalized carbon ion mass spectra for Nano-C fullerene black with electron beam on (black) and off (gray/red). (b) Normalized mass spectra for Alfa Aesar fullerene soot with electron beam on (black) and off (gray/red). The laser vaporizer is on in both cases. (c) The ratio of carbon ions with electron beam OFF-to-ON for both materials as a function of m/z. The fractional carbon ion signals for electron beam OFF-to-ON from pure C60 is also included in (c) for the five m/z ion peaks with reasonable signal-to-noise; C60+ is the lowest point at the highest m/z in this case.
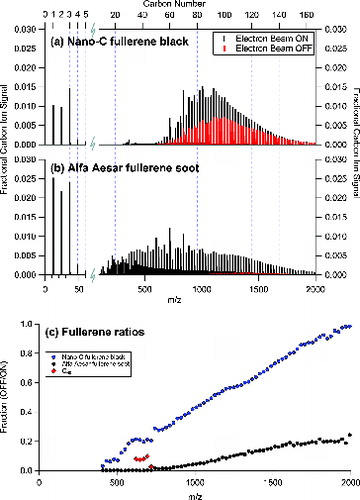
FIG. 4. Laser power studies for (a) Regal black, showing the invariance of C1+–C5+ with laser power, (b) Nano-C fullerene black, showing different laser power dependences for C3+, C602+, C60+, and the total fullerene ion signal (C30+/C602+ to C166+), and (c) C60, showing similarities in laser power dependences for the parent C60+ and C602+ ions and the fragment C3+ and C58+ ions. The laser power axis is a relative measure of the intracavity laser vaporizer power obtained by measuring light leaking through the mirror end of the laser cavity (see text for details).
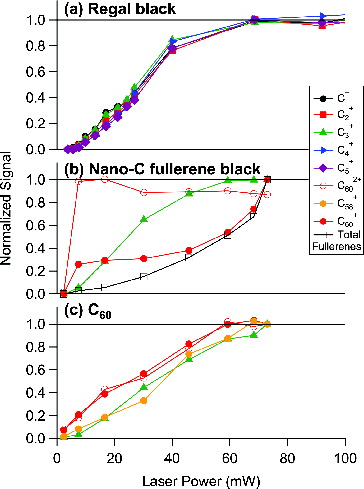
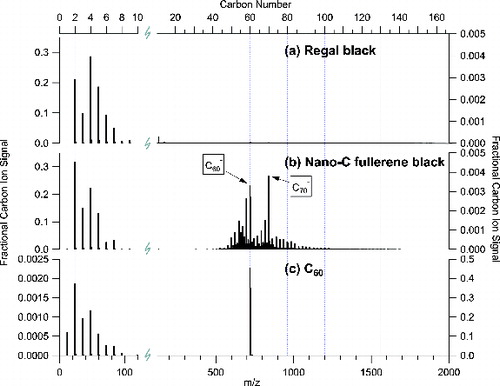
FIG. 5. Normalized negative carbon ion mass spectra for (a) Regal black, (b) Nano-C fullerene black, and (c) C60. The scales for the right axes of (a) and (b) are 1:70; the scale for the left axis of (c) is 1:200. The C1−–C10− region has been expanded for clarity.