Figures & data
FIG. 1. Schematic overview of measurement setup. Tube lengths are not to scale.
FIG. 2. (a–d) Size distributions as measured by FMPS, SMPS, and ELPI in the sub-micron size range (90, 150, 350, and 500 nm as measured by SMPS and ELPI).
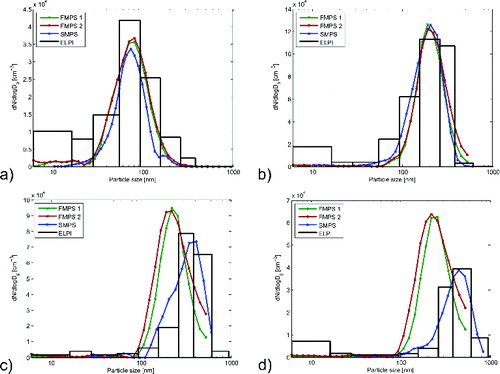
FIG. 3. Fitted GMDs from FMPSs and ELPI plotted against GMDs from SMPS.
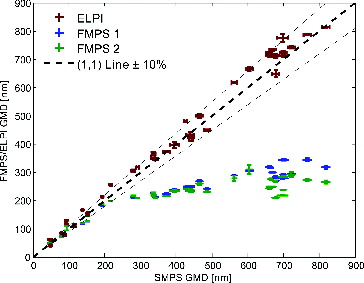
FIG. 4. Concentrations of FMPS, ELPI, and CPC normalized with that of SMPS. Dashed line indicates the upper measurement limit of the FMPS.
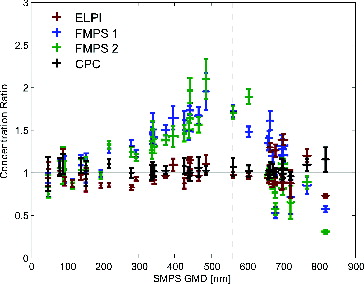
FIG. 5. Electrometer response distribution normalized by total concentration. GMD values as measured by SMPS.
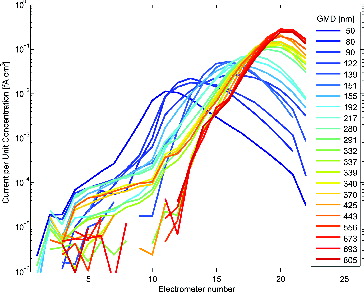
FIG. 6. Concentration ratio between FMPS and SMPS corrected with respective GMD and charging parameter.
FIG. 7. Calculated electrical mobility as a function of particle size. Dark shaded area denotes 95% confidence bounds based on fitting, light shaded area the size range of the FMPS. Dashed line indicates penetration through FMPS inlet cyclone pre-separator.