
Figures & data
FIG. 1. Average of ((κRH – κ>90)/κ>90) against RH for the 58 cycles of GF-RH measurements. Note that there is only one data point at 20% RH, hence no standard deviation is available.
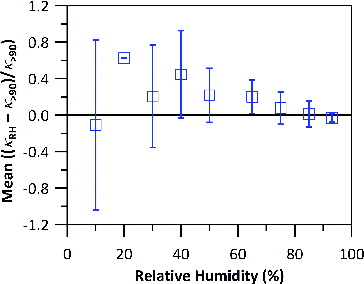
FIG. 2. GF as a function of RH for (a) Group 1a: less hygroscopic without hysteresis, (b) Group 1b: less hygroscopic with hysteresis, (c) Group 2: moderately hygroscopic with hysteresis, and (d) Group 3: more hygroscopic with hysteresis of ambient aerosols. Both dehydration (circle [blue] and solid line) and hydration (diamond [red] and dashed line) routes are shown. The lines connect the average GF at each RH.
![FIG. 2. GF as a function of RH for (a) Group 1a: less hygroscopic without hysteresis, (b) Group 1b: less hygroscopic with hysteresis, (c) Group 2: moderately hygroscopic with hysteresis, and (d) Group 3: more hygroscopic with hysteresis of ambient aerosols. Both dehydration (circle [blue] and solid line) and hydration (diamond [red] and dashed line) routes are shown. The lines connect the average GF at each RH.](/cms/asset/8e126721-43a3-4fa1-bc8d-5635cbb8d64c/uast_a_1058482_f0002_oc.jpg)
TABLE 1 Summary of κ>90, mass, mass fractions of organics, sulfate, nitrate, ammonium, and mole ratio of (NH4-NO3)/SO4
FIG. 3. Correlation plots between κ>90 or κf and mass fractions of (a) total organic, (b) sulfate, (c) nitrate, (d) ammonium, and (e) mole ratio of ammonium nitrate to sulfate. Correlation plot between (f) mole ratio of ammonium nitrate to sulfate and total organic mass fraction is also obtained. Dashed lines in each plot are the linear fittings between the two parameters, with an R2 at the bottom left corner.
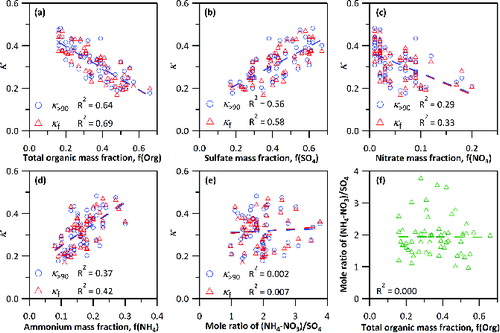
FIG. 4. Closure analysis between κ′ calculated from regression Model III and (a) κ>90 (triangle [green]) or (b) κf (circle [red]). Closure analysis between κ′ calculated using ZSR mixing rule (square [purple]) and κ>90 is also plotted in (a).
![FIG. 4. Closure analysis between κ′ calculated from regression Model III and (a) κ>90 (triangle [green]) or (b) κf (circle [red]). Closure analysis between κ′ calculated using ZSR mixing rule (square [purple]) and κ>90 is also plotted in (a).](/cms/asset/0c52f6cc-0df7-4e1b-b999-6ba1996e8e6c/uast_a_1058482_f0004_oc.jpg)
FIG. 5. Example of datasets of which the fitted (dashed line) and predicted GF curves obtained by κ′>90 (square [blue] and dashed line) or κ′ZSR (circle [green] and solid line) agree yet deviate from the measured GF-RH trend (circle [red]).
![FIG. 5. Example of datasets of which the fitted (dashed line) and predicted GF curves obtained by κ′>90 (square [blue] and dashed line) or κ′ZSR (circle [green] and solid line) agree yet deviate from the measured GF-RH trend (circle [red]).](/cms/asset/e819cb5f-c732-4e07-a486-409fa9d6f5d6/uast_a_1058482_f0005_oc.jpg)
FIG. 6. Measured GF (circle [red]) and predicted GF calculated using κ′ZSR (circle [green] and solid line) of 17 cycles of which κ′ZSR and κ>90 differ by over 20%.
![FIG. 6. Measured GF (circle [red]) and predicted GF calculated using κ′ZSR (circle [green] and solid line) of 17 cycles of which κ′ZSR and κ>90 differ by over 20%.](/cms/asset/b08245b0-6aba-4644-83e4-ea5dd8cfe325/uast_a_1058482_f0006_oc.jpg)
FIG. 7. Performance test of κ′ on (a) seven sets of GF measurements made in January and February 2012, which were not parameterized, and (b) six sets made in August 2012. Predicted GF curves calculated by κ′>90 (square [blue] and dashed line) obtained from Model III or κ′ZSR (circle [green] and solid line) is compared with actual measurements made by the HTDMA (circle [red]).
![FIG. 7. Performance test of κ′ on (a) seven sets of GF measurements made in January and February 2012, which were not parameterized, and (b) six sets made in August 2012. Predicted GF curves calculated by κ′>90 (square [blue] and dashed line) obtained from Model III or κ′ZSR (circle [green] and solid line) is compared with actual measurements made by the HTDMA (circle [red]).](/cms/asset/8ace365c-3fe8-4c92-9904-77d9a9342968/uast_a_1058482_f0007_oc.jpg)