Figures & data
TABLE 1 Solution-based pMDI formulations
FIG. 1. Photograph of the inlet air heating assembly (a) and cross-sectional view of canister housing and actuation block (b) connected to an eight-stage Andersen cascade impactor with standard USP induction port.
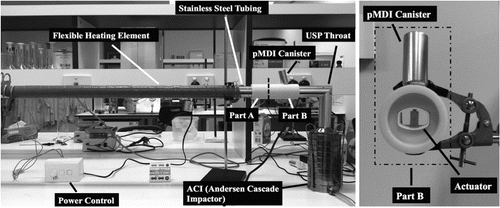
FIG. 2. Temperature and humidity profiles at the actuator block downstream from the inlet air heating assembly.
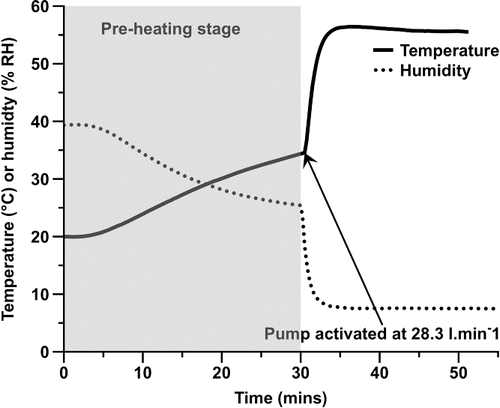
FIG. 3. Andersen cascade impactor percentage stage mass deposition of budesonide from pMDI formulations containing 0 to 1% glycerol w/w at (a) 25°C and (b) 55°C.
TABLE 2 MMAD, GSD and FPF of glycerol-containing budesonide solution pMDI formulations at 25°C and 55°C (n = 3, ± StDev)
FIG. 4. Temporal obscuration rate of each experimental pMDI formulation as a function of time: (a) 25°C and (b) 55°C.
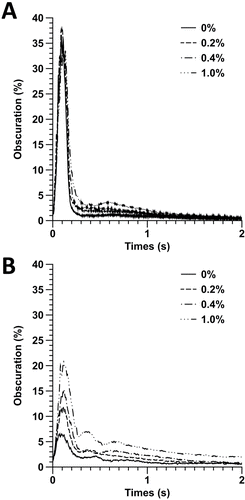
FIG. 5. Size distribution of particles released from the experimental pMDI formulations: (a) 25°C and (b) 55°C.
FIG. 6. Cumulative mass undersize percentage of each pMDI formulation at (a) 25°C and (b) 55°C, with theoretical fit based on Equation (Equation5[5] ).
![FIG. 6. Cumulative mass undersize percentage of each pMDI formulation at (a) 25°C and (b) 55°C, with theoretical fit based on Equation (Equation5[5] ).](/cms/asset/1b1767a2-deaf-4859-ba8e-f9773e3bec2c/uast_a_1096897_f0006_b.gif)
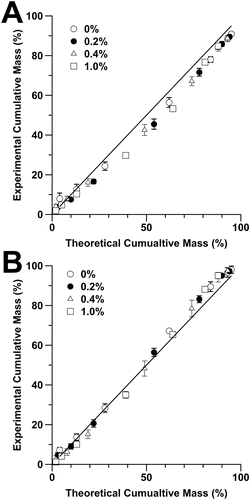
FIG. 7. Plot of experiemental vs. theoretical cumulative mass values at (a) 25°C and (b) 55°C. Line indicates exact correlation.