Figures & data
FIG. 1. Velocity profile in PIPS collection tube. The shaded triangular region depicts the width of the inviscid core region for a developing laminar flow.
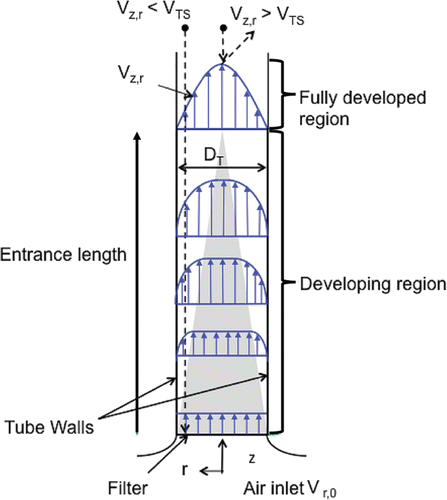
TABLE 1 PIPS cut sizes (aerodynamic particle diameter) and associated filter velocity and flow properties
FIG. 2. Diagram of a turbulent jet exiting the PIPS. The shaded region represents the spreading jet. The virtual source is located inside the tube geometry and is the point from which the jet originates.
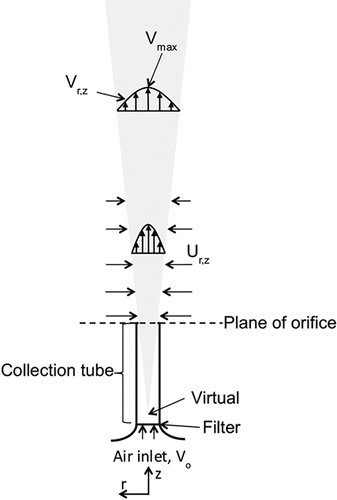
FIG. 3. PIPSv2 design schematic illustrating (a) airflow and particle behavior and (b) dimensions. White arrows indicate airflow direction; dashed lines indicate potential path lines for particles entering the sampler.
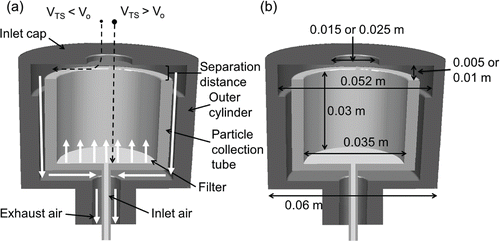
TABLE 2 PIPSv2 flow rates for each cut size
TABLE 3 CFD simulation variables
FIG. 4. (a) PIPS sampler, (b) top view of the opened PIPSv2 sampler, (c) PIPSv2 seen from above with inlet cap, and (d) side view of the PIPSv2 sampler. The annular slit in (b) carries the upward flow away from the inlet, forming a stagnation point and the center of the PIPSv2 inlet in (c).
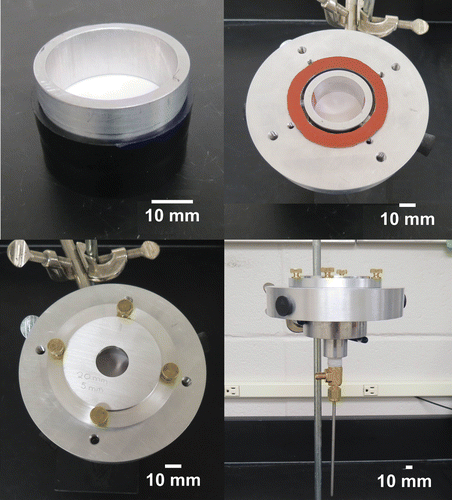
FIG. 5. Schematic of the calm-air chamber and experimental setup. Particles are aspirated into the upper section of the calm-air chamber and settle into the testing section. Reference samplers are located in the testing section.
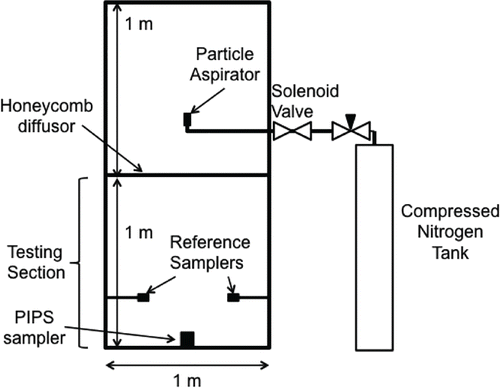
FIG. 6. Image of particles on a reference filter. On the left is the raw fluorescent image and on the right is the ImageJ rendering.
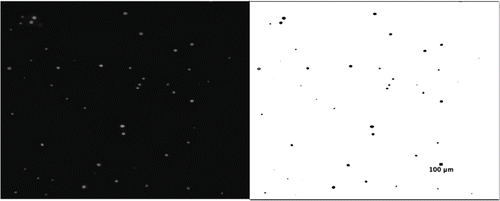
TABLE 4 Experimental coefficients for Equation (Equation4[4] ) for the PIPS sampler and each cut point PIPS Sampler
TABLE 5 Experimental coefficients for Equation (Equation4[4] ) for the PIPSv2 sampler and each cut point PIPSv2 Sampler
TABLE 6 Aerodynamic particle size and count statistics for locations in the calm-air chamber
FIG. 7. Experimental and simulated sampling efficiency for the PIPS and PIPSv2 samplers for (a) 30, (b) 40, (c) 50, (d) 60, (e) 70, and (f) 80 μm cut points. CFD modeling of the PIPSv2 sampler (20 mm inlet, 5 mm separation distance) is represented by the solid line; CFD modeling of the PIPS sampler is represented by the dashed grey line. The experimental PIPSv2 results are represented by the solid markers and the experimental PIPS results are represented by the open markers.
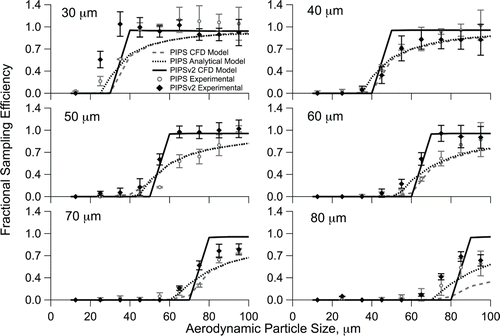
FIG. 8. Effect of inlet size and separation distance on PIPSv2 sampling efficiency. All tests shown for a 70 μm cut size. Error bars represent one standard deviation about repeated tests.
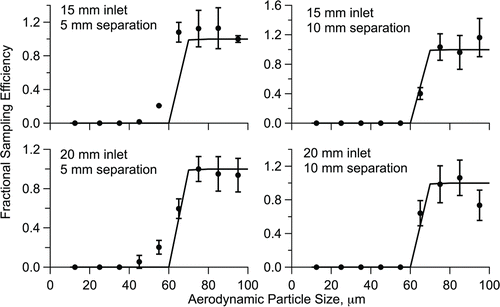
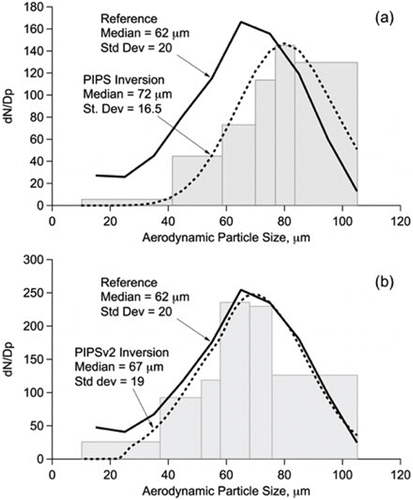
FIG. 9. Size distribution in the chamber estimated by (a) PIPS and (b) PIPSv2 samplers. The reference size distribution was measured by optical microscopy of settled dust (solid line in both graphs). The light-gray bars represent the raw particle counts for each stage.