
Figures & data
Figure 1. Schematic of the experimental setup.
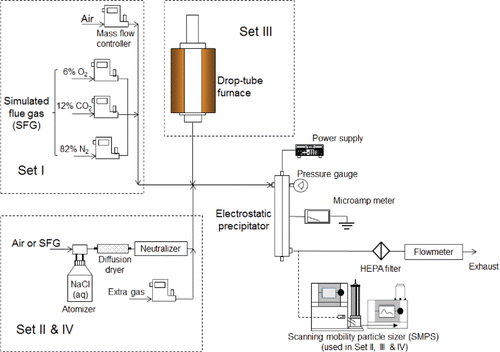
Table 1. Summary of performed studies.
Figure 2. The influences of gas pressure on (a) I-V characteristics and (b) corona onset voltage with different gas compositions (air and SFG). (a) I-V curves of the ESP under three pressure conditions (1, 2, and 3 atm) with air and SFG as the feed gas, respectively; (b) the relationship between the corona onset voltage and gas pressure (experimental results for air and SFG, estimation for air case based on Equation (Equation2[2] ), and fitting curve for SFG case; “pos”: short for “positive”; “neg”: short for “negative”).
![Figure 2. The influences of gas pressure on (a) I-V characteristics and (b) corona onset voltage with different gas compositions (air and SFG). (a) I-V curves of the ESP under three pressure conditions (1, 2, and 3 atm) with air and SFG as the feed gas, respectively; (b) the relationship between the corona onset voltage and gas pressure (experimental results for air and SFG, estimation for air case based on Equation (Equation2[2] ), and fitting curve for SFG case; “pos”: short for “positive”; “neg”: short for “negative”).](/cms/asset/2e0e8662-48ac-489e-b904-f25225b197fc/uast_a_1216071_f0002_b.gif)
Figure 3. Experimental and calculated I-V curves by Equations (Equation5[5] ) and (Equation6
[6] ) under different pressures.
![Figure 3. Experimental and calculated I-V curves by Equations (Equation5[5] ) and (Equation6[6] ) under different pressures.](/cms/asset/8fc32138-9ed8-4332-a78b-2254a1de0f57/uast_a_1216071_f0003_b.gif)
Figure 4. NaCl particle penetrations through the ESP using air as feed gas under different gas pressures: (a) negative ESP, voltage controlled; (b) positive ESP, voltage controlled; (c) negative ESP, current controlled; (d) positive ESP, current controlled.
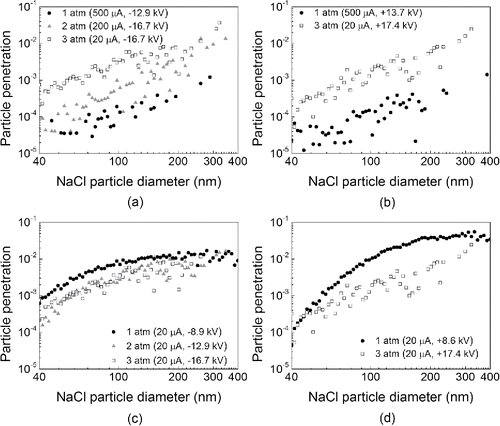
Figure 5. NaCl particle penetrations through the ESP using SFG as feed gas under different gas pressures: (a) negative ESP, voltage controlled; (b) positive ESP, voltage controlled; (c) negative ESP, current controlled; (d) positive ESP, current controlled.
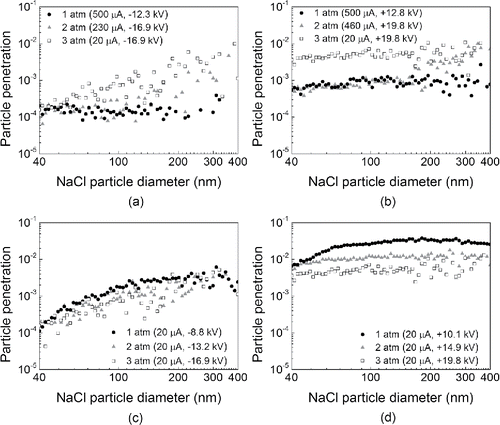
Figure 6. Particle penetrations through the ESP for fly ash particles of various sizes under different gas pressures.
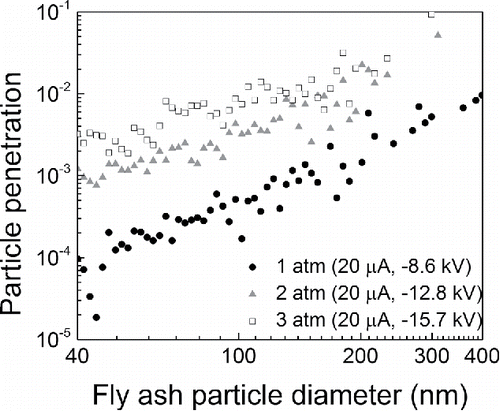
Figure 7. Calculating procedure of capture efficiency in pressurized ESPs using Equation (Equation20[19] ) as the modified expression for the number of elementary charges of the particles.
![Figure 7. Calculating procedure of capture efficiency in pressurized ESPs using Equation (Equation20[19] ) as the modified expression for the number of elementary charges of the particles.](/cms/asset/f6393c98-80f1-4e17-bb2f-12b1aedb8107/uast_a_1216071_f0007_oc.gif)
Figure 8. Particle penetrations for various particle sizes measured under 1, 2, and 3 atm and the corresponding calculated values using Equation (Equation20[19] ) (summation of squared deviations [σ'] is 0.0022, which excludes the case of “1 atm and 20 µA”).
![Figure 8. Particle penetrations for various particle sizes measured under 1, 2, and 3 atm and the corresponding calculated values using Equation (Equation20[19] ) (summation of squared deviations [σ'] is 0.0022, which excludes the case of “1 atm and 20 µA”).](/cms/asset/f4705c80-5a9b-4853-b8a1-de780f418124/uast_a_1216071_f0008_b.gif)
Figure 9. Particle penetrations for various particle sizes measured under 1.5 and 2.5 atm and the corresponding calculated values using Equation (Equation20[19] ).
![Figure 9. Particle penetrations for various particle sizes measured under 1.5 and 2.5 atm and the corresponding calculated values using Equation (Equation20[19] ).](/cms/asset/c45c99a1-05fd-4b76-8a28-a6a1c512eb75/uast_a_1216071_f0009_b.gif)