Figures & data
Figure 1. The scheme of the apparatus: (1) deoxygenator, (2) dryer, (CV) control valve, (D) diluter, (F) filter, (MFC) electronic mass flow controller, (N) aerosol neutralizer Am241, (P) pressure reducing valve, (S) saturator, (SF) sampling filter, and (VP) vacuum pump.
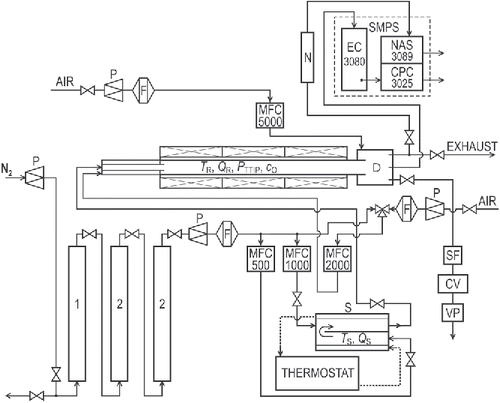
Figure 2. The dependence of Nt, GMD, St, Mt, and number, mass and surface particle size distributions on time and experimental conditions (TR, QR, PTTIP, cO) during 3rd experimental campaign. Vertical gray bars highlight sampling periods, F denotes Ag filter, FC cellulose filter, and FQ quartz filter.
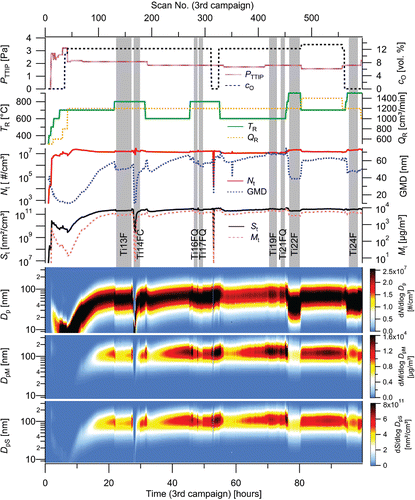
Figure 3. Stability of NPs production in the form of number, surface, and mass particle size distributions during 12 h long steady-state period, TR = 700°C, QR = 1400 cm3/min, PTTIP = 1.59 Pa, cO = 13.5 vol. %, 3rd experimental campaign.
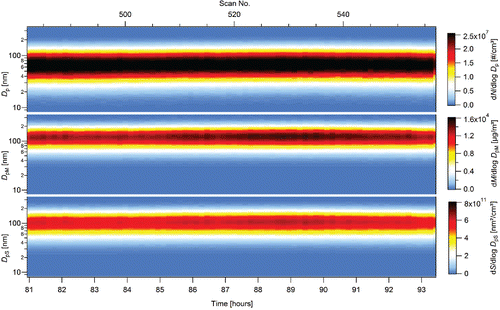
Figure 4. A development of the particle size distribution during start-up period, 3rd experimental campaign, TR = 700°C, QR = 1200 cm3/min, PTTIP = 2.14 Pa, cO = 12 vol. %.
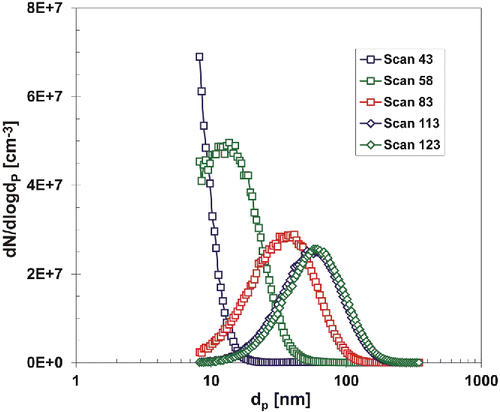
Table 1. Morphological properties and SAED characteristics of NPs synthesized at various experimental conditions.
Figure 5. TEM images and electron diffraction patterns of the samples of NPs synthesized at 500 (Ti33G) and 900°C (Ti23G), respectively.
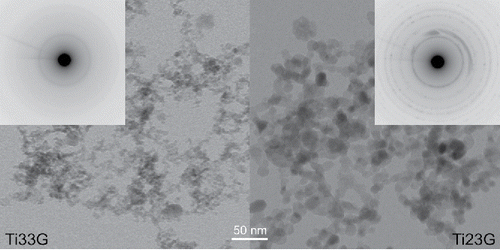
Figure 6. TEM images and electron diffraction patterns of the samples of NPs synthesized at 800°C by pyrolysis (Ti18G) and oxidation (Ti15G), respectively.
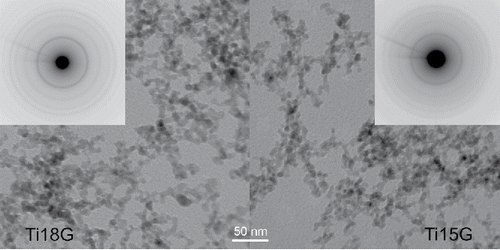
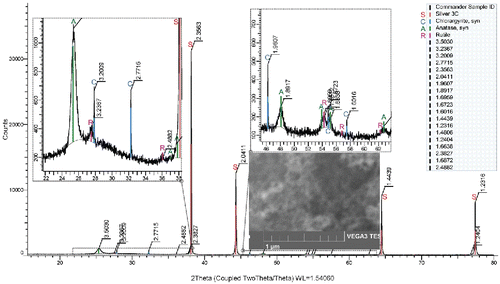
Figure 7. XRD pattern and SEM image (inset) of the sample Ti19F, TR = 600°C, QR = 1200 cm3/min, PTTIP = 1.9 Pa, cO = 12 vol %, A denotes anatase, C chlorargyrire, and S silver.
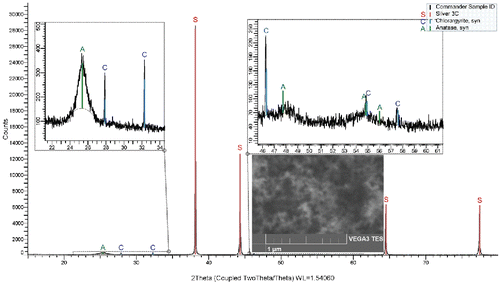
Figure 8. XRD pattern and SEM image (inset) of the sample Ti24F, TR = 900°C, QR = 1200 cm3/min, PTTIP = 1.9 Pa, cO = 0, A denotes anatase, C chlorargyrire, R rutile, and S silver.