3,883
Views
77
CrossRef citations to date
0
Altmetric
Original Articles

Laboratory characterization of an aerosol chemical speciation monitor with PM2.5 measurement capability

, , , , , , , , & show all
Pages 69-83 | Received 26 Jun 2016, Accepted 21 Sep 2016, Published online: 18 Oct 2016

Figures & data

Figure 1. Schematic of the experimental setup for (a) large particle size (>650 nm dva) lens transmission and particle bounce measurement, (b) and (c) small particle size side (<650 nm dva) lens transmission efficiency curve measurement without CPMA and with CPMA, respectively, and (d) schematic of an ACSM/AMS equipped with the new PM2.5 inlet, IPL, and capture vaporizer.
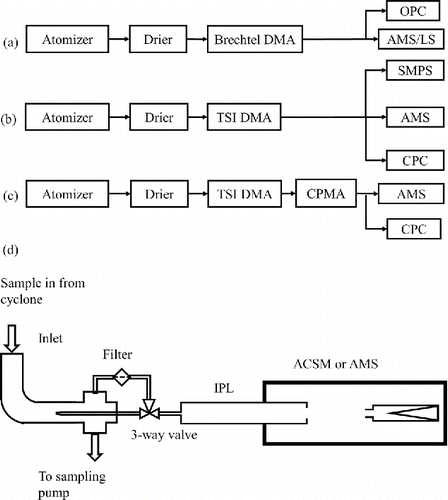
Figure 1. Schematic of the experimental setup for (a) large particle size (>650 nm dva) lens transmission and particle bounce measurement, (b) and (c) small particle size side (<650 nm dva) lens transmission efficiency curve measurement without CPMA and with CPMA, respectively, and (d) schematic of an ACSM/AMS equipped with the new PM2.5 inlet, IPL, and capture vaporizer.

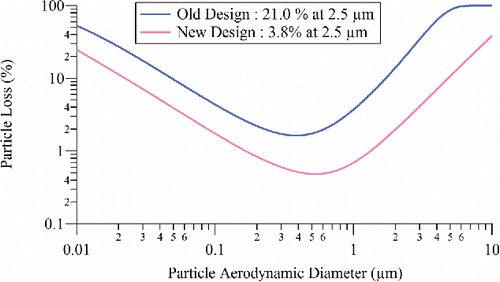
Figure 2. Calculated size-dependent particle loss for the old and new designs of the ACSM inlet.

Figure 2. Calculated size-dependent particle loss for the old and new designs of the ACSM inlet.

Figure 3. (a) Average PM2.5 lens transmission efficiency (EL) measured using NH4NO3, NaNO3, and PSL particles for different lens assemblies compared with that of PM1 lens from Liu et al. (Citation2007) (error bars are one standard deviation and 50% cutoff sizes are indicated by arrows). The transmission cutoff of the PM2.5 EPA Federal Reference Method (FRM) WINS (Well impactor ninety-six) separator, converted to vacuum aerodynamic diameter using an average ambient particle density of 1.6 g/cm3 (Hu et al. Citation2012), is shown for reference. (b) Velocity calibration of the IPL compared with those of the standard lens (PM1) and the high pressure lens (HPL). From top to bottom, the traces are HPL, IPL, and standard PM1 lens. Blue solid points are NH4NO3 results, while red solid points are NaNO3 results. The fit coefficients are given in .
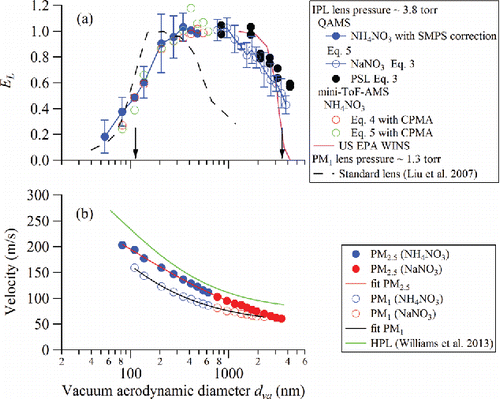
Figure 3. (a) Average PM2.5 lens transmission efficiency (EL) measured using NH4NO3, NaNO3, and PSL particles for different lens assemblies compared with that of PM1 lens from Liu et al. (Citation2007) (error bars are one standard deviation and 50% cutoff sizes are indicated by arrows). The transmission cutoff of the PM2.5 EPA Federal Reference Method (FRM) WINS (Well impactor ninety-six) separator, converted to vacuum aerodynamic diameter using an average ambient particle density of 1.6 g/cm3 (Hu et al. Citation2012), is shown for reference. (b) Velocity calibration of the IPL compared with those of the standard lens (PM1) and the high pressure lens (HPL). From top to bottom, the traces are HPL, IPL, and standard PM1 lens. Blue solid points are NH4NO3 results, while red solid points are NaNO3 results. The fit coefficients are given in Table 1.

Table 1. Summary of velocity calibration fitting parameters for standard PM1, IPL, and HPL lenses. The formula used for fitting is , which is from Williams et al. (Citation2013).

Figure 4. Schematic diagram of particles impacting the standard vaporizer (a and b) and capture vaporizer (c), showing (a) flash vaporization, (b) bounce off the surface, and (c) trapped and delayed vaporization. Shading represents idealized vapor plume. Black arrow indicates attachment point of the thermocouple.
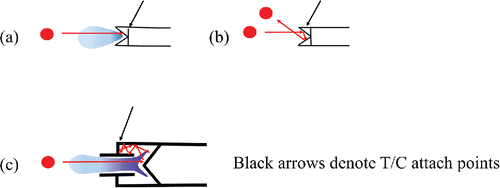
Figure 4. Schematic diagram of particles impacting the standard vaporizer (a and b) and capture vaporizer (c), showing (a) flash vaporization, (b) bounce off the surface, and (c) trapped and delayed vaporization. Shading represents idealized vapor plume. Black arrow indicates attachment point of the thermocouple.

Figure 5. Collection efficiency due to particle bounce, EB, plotted as a function of particle size on the standard vaporizer and capture vaporizer for NaNO3 particles. (Dashed lines are guides for the eye).
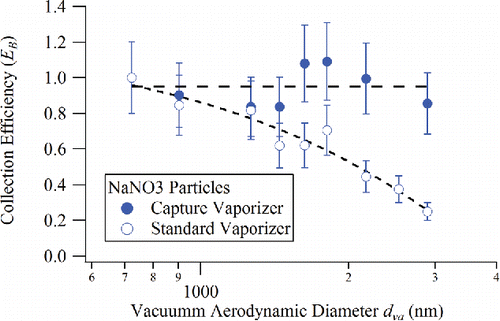
Figure 5. Collection efficiency due to particle bounce, EB, plotted as a function of particle size on the standard vaporizer and capture vaporizer for NaNO3 particles. (Dashed lines are guides for the eye).

Figure 6. (a) Q-AMS measured sulfate loading vs. CPMA and CPC calculated sulfate loading for standard and capture vaporizers. (b) Q-AMS measured NH4 loading vs. CPMA and CPC calculated NH4 loading for standard and capture vaporizers. (c) Chemical composition-dependent collection efficiency (CDCE) for capture vaporizer compared with that for standard vaporizer.
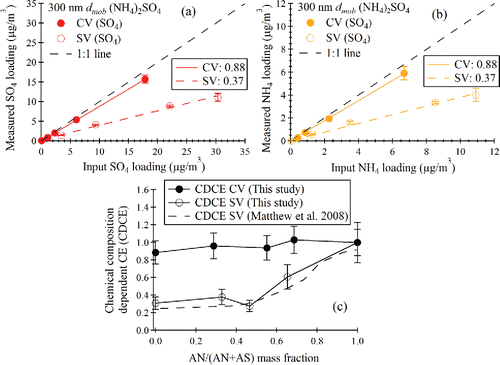
Figure 6. (a) Q-AMS measured sulfate loading vs. CPMA and CPC calculated sulfate loading for standard and capture vaporizers. (b) Q-AMS measured NH4 loading vs. CPMA and CPC calculated NH4 loading for standard and capture vaporizers. (c) Chemical composition-dependent collection efficiency (CDCE) for capture vaporizer compared with that for standard vaporizer.

Figure 7. (a) Δχ2 contour plot used for to determine RIE's from mixed NH4NO3 (AN)/(NH4)2SO4 (AS) particles. A Δχ2 value of 2.3 denotes the range of RIE values for 1 sigma uncertainties. (b) Measured AS/(AS + AN) mass fraction vs. input mass fraction in the atomizer solution. (c) Measured NH4 vs. NH4 predicted from measured NO3 and SO4. The fitting equation is NH4meas = b × NH4predict + a.
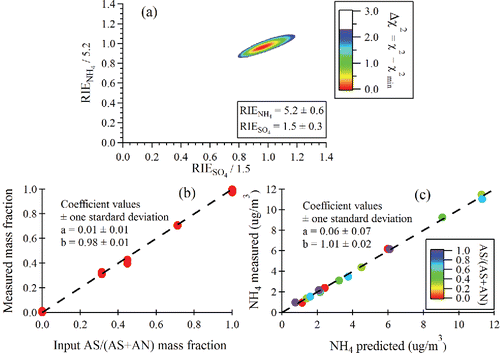
Figure 7. (a) Δχ2 contour plot used for to determine RIE's from mixed NH4NO3 (AN)/(NH4)2SO4 (AS) particles. A Δχ2 value of 2.3 denotes the range of RIE values for 1 sigma uncertainties. (b) Measured AS/(AS + AN) mass fraction vs. input mass fraction in the atomizer solution. (c) Measured NH4 vs. NH4 predicted from measured NO3 and SO4. The fitting equation is NH4meas = b × NH4predict + a.

Figure 8. Mapping of the capture vaporizer surface using the m/z 46 to m/z 30 + m/z 46 ratio and the total m/z 30 + m/z 46 signal. The edges of the capture vaporizer are indicated with short-dashed vertical lines, and the edges of the opening to the internal cavity are indicated with long-dashed vertical lines. The black trace is a typical ambient aerosol beam width profile (Salcedo et al. Citation2007) produced by a PM1 lens in an AMS, and projected on the dimension of the capture vaporizer at the ACSM chamber length.
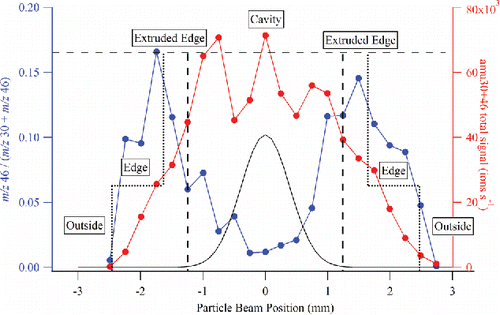
Figure 8. Mapping of the capture vaporizer surface using the m/z 46 to m/z 30 + m/z 46 ratio and the total m/z 30 + m/z 46 signal. The edges of the capture vaporizer are indicated with short-dashed vertical lines, and the edges of the opening to the internal cavity are indicated with long-dashed vertical lines. The black trace is a typical ambient aerosol beam width profile (Salcedo et al. Citation2007) produced by a PM1 lens in an AMS, and projected on the dimension of the capture vaporizer at the ACSM chamber length.

Figure 9. Fragmentation patterns observed in the CV (solid) and the SV (shaded) for NH4 (left four bar pairs [yellow]), NO3 (middle bar pair [blue]), and SO4 (right four bar pairs [red]). The NH4 measurements are shown for both NH4NO3 and (NH4)2SO4.

Figure 9. Fragmentation patterns observed in the CV (solid) and the SV (shaded) for NH4 (left four bar pairs [yellow]), NO3 (middle bar pair [blue]), and SO4 (right four bar pairs [red]). The NH4 measurements are shown for both NH4NO3 and (NH4)2SO4.

Table 2(a). Modified fragmentation table entries for sulfate for the CV. The frag_NO3 is unchanged, although the m/z 46/30 ratio has changed.

(b). Corresponding standard frag table for the SV.

Figure 10. Normalized species concentrations measured at different CV temperatures for mixed NH4NO3 and (NH4)2SO4 particles and for organic (α-pinene ozonolysis SOA) particles.
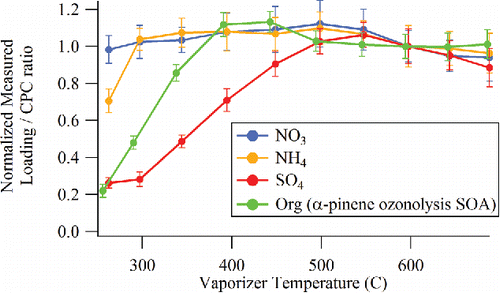
Figure 10. Normalized species concentrations measured at different CV temperatures for mixed NH4NO3 and (NH4)2SO4 particles and for organic (α-pinene ozonolysis SOA) particles.

Figure 11. pToF profiles for selected SO4-related ions (m/z 48 and 64), selected NH4-related ions (m/z 15, 16, and 17), selected NO3-related ions (m/z 30 and 46), and selected organic-related ions (m/z 43, 44, and 45) for (a) NH4NO3 with SV, (b) NH4NO3 with CV, (c) (NH4)2SO4 with SV, (d) (NH4)2SO4 with CV, (e) glutaric acid with SV, and (f) glutaric acid with CV (× x: x is the scaling factor).
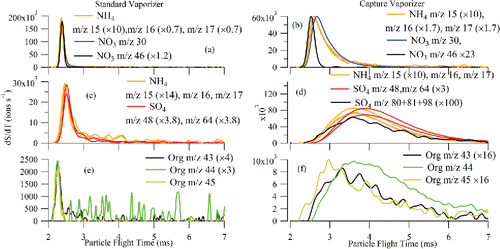
Figure 11. pToF profiles for selected SO4-related ions (m/z 48 and 64), selected NH4-related ions (m/z 15, 16, and 17), selected NO3-related ions (m/z 30 and 46), and selected organic-related ions (m/z 43, 44, and 45) for (a) NH4NO3 with SV, (b) NH4NO3 with CV, (c) (NH4)2SO4 with SV, (d) (NH4)2SO4 with CV, (e) glutaric acid with SV, and (f) glutaric acid with CV (× x: x is the scaling factor).
Supplemental material

UAST_1241859_Supplemental_File.zip

Download Zip (536.5 KB)

Reprints and Corporate Permissions

Please note: Selecting permissions does not provide access to the full text of the article, please see our help page How do I view content?

To request a reprint or corporate permissions for this article, please click on the relevant link below:

Academic Permissions

Please note: Selecting permissions does not provide access to the full text of the article, please see our help page How do I view content?

Obtain permissions instantly via Rightslink by clicking on the button below:

If you are unable to obtain permissions via Rightslink, please complete and submit this Permissions form. For more information, please visit our Permissions help page.