1,419
Views
9
CrossRef citations to date
0
Altmetric
Articles

The influence of lung volume during imaging on CFD within realistic airway models

, , , , , & show all
Pages 214-223 | Received 24 Aug 2016, Accepted 14 Oct 2016, Published online: 18 Nov 2016

Figures & data

Figure 1. Lung envelopes and airways segmented from HRCT images at MLV (left) and TLC (right) for subject H147.
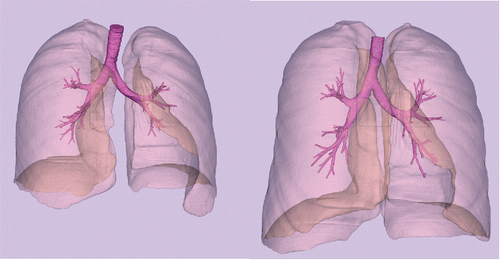
Figure 1. Lung envelopes and airways segmented from HRCT images at MLV (left) and TLC (right) for subject H147.

Table 1. Subject data and air volume from imaging. NA is not applicable. UA is unavailable.

Table 2. Characteristics of the computational fluid dynamics geometry models.

Figure 2. Airway geometry models based on imaging at MLV (left) and TLC (right) for subject H147. Note that the images are at slightly different orientation based on the position of the subject when imaged. Particle deposition results are for 5 µm particles with 30 L/min inhalation flow rate.
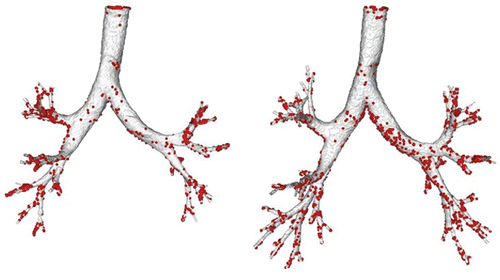
Figure 2. Airway geometry models based on imaging at MLV (left) and TLC (right) for subject H147. Note that the images are at slightly different orientation based on the position of the subject when imaged. Particle deposition results are for 5 µm particles with 30 L/min inhalation flow rate.

Figure 3. Comparison of MLV vs. TLC data points given in to the identity line for (a) right lung deposition fraction, (b) left lung deposition fraction, and (c) penetration fraction.
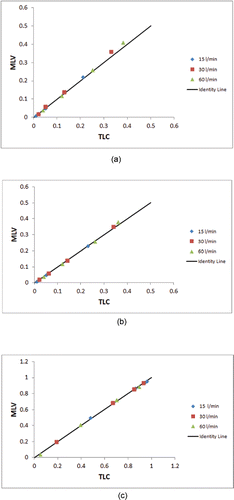
Figure 3. Comparison of MLV vs. TLC data points given in Table 3 to the identity line for (a) right lung deposition fraction, (b) left lung deposition fraction, and (c) penetration fraction.
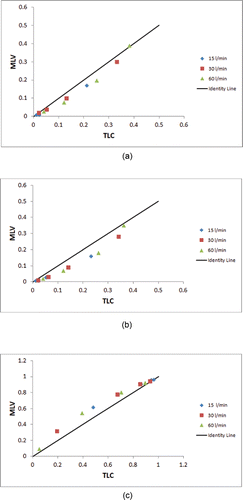
Figure 4. Comparison of MLV vs. the “cut” TLC data points given in to the identity line for (a) right lung deposition fraction, (b) left lung deposition fraction, and (c) penetration fraction.

Figure 4. Comparison of MLV vs. the “cut” TLC data points given in Table 5 to the identity line for (a) right lung deposition fraction, (b) left lung deposition fraction, and (c) penetration fraction.

Table 3. Computational fluid dynamics results of average large-scale deposition fractions for each test case.

Table 4. Computational fluid dynamics results of average local deposition fractions in the right upper lobe for each test case.

Table 5. Computational fluid dynamics results of average large-scale deposition fractions for each test case where the deposition fractions for the TLC models are “cut” to match the MLV depth.

Table 6. Computational fluid dynamics results of deposition for subject H147.

Reprints and Corporate Permissions

Please note: Selecting permissions does not provide access to the full text of the article, please see our help page How do I view content?

To request a reprint or corporate permissions for this article, please click on the relevant link below:

Academic Permissions

Please note: Selecting permissions does not provide access to the full text of the article, please see our help page How do I view content?

Obtain permissions instantly via Rightslink by clicking on the button below:

If you are unable to obtain permissions via Rightslink, please complete and submit this Permissions form. For more information, please visit our Permissions help page.